Reason to trust

How Our News is Made
Strict editorial policy that focuses on accuracy, relevance, and impartiality
Ad discliamer
Morbi pretium leo et nisl aliquam mollis. Quisque arcu lorem, ultricies quis pellentesque nec, ullamcorper eu odio.
Key Highlights
- Ethereum price showed a lot of resiliency and traded higher this past week vs the US dollar.
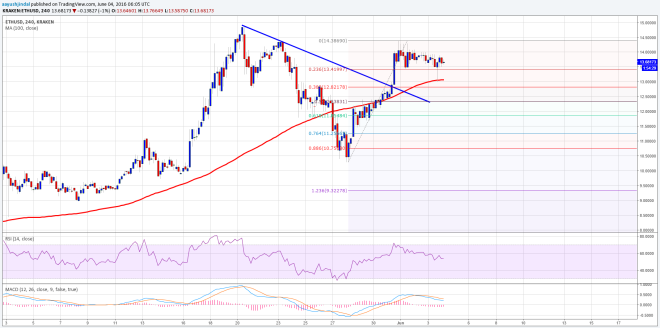
- There was a bearish trend line formed on the 4-hours chart (data feed via Kraken) of ETH/USD, which was breached during the upside move.
- The price also settled above the 100 simple moving average (H4), which is a sign that ETH bulls are in control.
Ethereum price managed to stay positive despite a lot of pressure from BTC. Can the current trend in ETH/USD continue moving ahead?
Ethereum Price – Move Towards $15.00?
Ethereum price ETH remained above the all-important $12.00 support area vs the US Dollar this past week, and mostly traded with a positive tone. I have been calling for a test of $15.00 in ETH/USD, but the price failed to gain momentum. It was mostly due to BTC climbing not only against the US Dollar, but also vs ETH. So, the ETH bulls struggled to gain pace vs the USD.
However, it still managed to post gains, and there was also a break above a bearish trend line formed on the 4-hours chart (data feed via Kraken) of ETH/USD. The price is currently consolidating gains and finding bids near the 23.6% Fib retracement level of the last leg from the $10.40 low to $14.38 high. The most important support is around the 100 simple moving average (H4), which is acting as a barrier for the ETH sellers.

If you are looking to enter a buy trade, then consider placing a stop below the 100 SMA, and I would still aim for a test of the $15.00 level.
4-hours MACD – The MACD is in the bearish slope, which is a concern for the ETH bulls.
4-hours RSI – The RSI is above the 50 level, suggesting that there is enough momentum to push the price higher.
Weekly Support Level – $12.80
Weekly Resistance Level – $14.50
Charts courtesy of Kraken via Trading View


