
Reason to trust
How Our News is Made
Strict editorial policy that focuses on accuracy, relevance, and impartiality
Ad discliamer
Morbi pretium leo et nisl aliquam mollis. Quisque arcu lorem, ultricies quis pellentesque nec, ullamcorper eu odio.
- ETH price recovered a few points, but it is facing a lot of hurdles near $114 against the US Dollar.
- There was a break above a major bearish trend line with resistance at $107 on the 4-hours chart of ETH/USD (data feed via Kraken).
- The pair is likely to accelerate higher if it succeeds in surpassing the $114 and $115 resistance levels.
Ethereum price is showing a few positive signs versus the US Dollar and Bitcoin. ETH/USD must break the $114 resistance to stay in the positive zone in the near term.
Ethereum Price Analysis
Recently, we saw a couple of swing moves in ETH price above the $102 and $104 levels against the US Dollar. Later, the ETH/USD pair formed a decent support above $104 and started an upward move. The pair gained momentum above the $104 and $107 resistance levels. Moreover, there was a break above the 23.6% Fib retracement level of the last decline from the $117 high to $101 swing low. The price traded with a positive bias above the $105 pivot zone.
Moreover, there was a break above a major bearish trend line with resistance at $107 on the 4-hours chart of ETH/USD. The pair tested the $109-110 resistance area where sellers emerged. Moreover, the price also failed near the 50% Fib retracement level of the last decline from the $117 high to $101 swing low. At the moment, the price action is positive above $107, but ETH is facing a lot of hurdles near the $109 and $112 resistance levels. More importantly, the 100 hourly simple moving average is also near the $112 level to act as a solid hurdle. Finally, the 61.8% Fib retracement level of the last decline from the $117 high to $101 swing low is at $112. Therefore, the price must break the $112-114 resistance area for an upside acceleration.
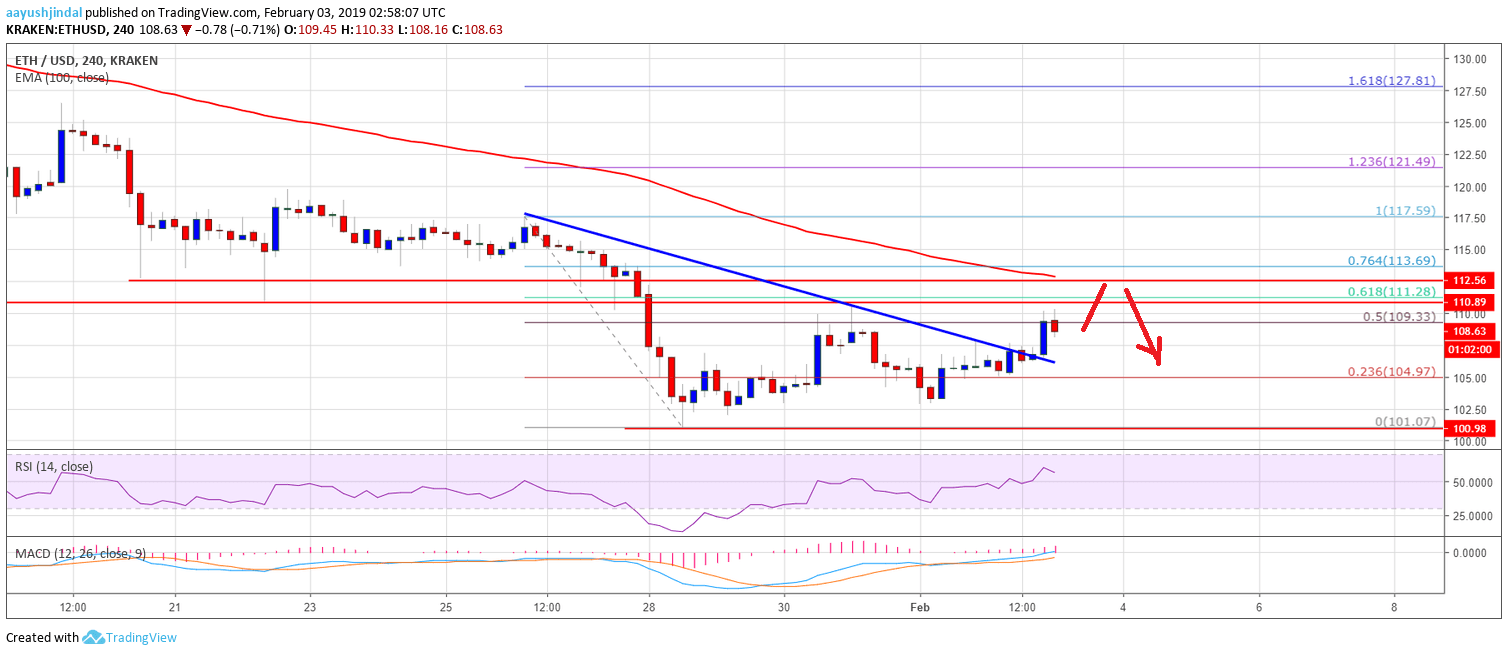
The above chart indicates that ETH price made a nice upward move above the $107 resistance. However, a proper close above $114 is needed for more gains in the near term.
Technical Indicators
4-hours MACD – The MACD for ETH/USD is slowly gaining pace in the bullish zone.
4-hours RSI – The RSI for ETH/USD is currently placed nicely above the 50 level.
Major Support Level – $107
Major Resistance Level – $114


