Key Highlights
- ETH price climbed higher this past week above the $880 level before facing sellers against the US Dollar.
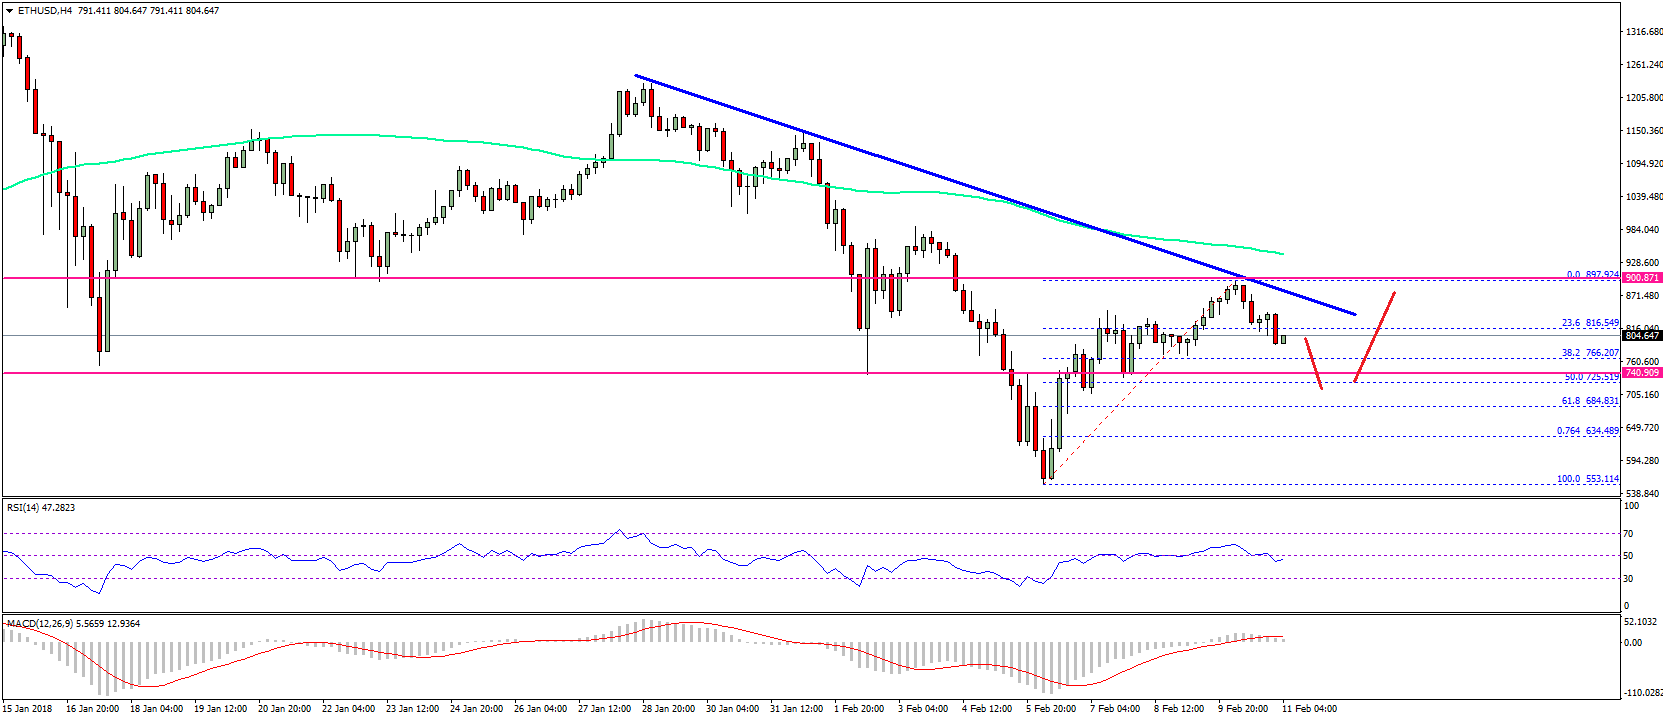
- There is a major bearish trend line forming with resistance at $860 on the 4-hours chart of ETH/USD (data feed via SimpleFX).
- The pair is currently correcting higher and it may correct further towards the $740 and $720 levels.
Ethereum price started a decent upside move against the US Dollar and Bitcoin. ETH/USD is currently correcting lower since it struggling to break the $890-900 levels.
Ethereum Price Trend
This past week, there was a good start to a new upside wave in ETH price above the $700 level against the US Dollar. The price made good ground and it was able to move above the $750 and $800 levels. However, the price struggled to move above the $880-900 resistance levels. It faced a strong sell zone near the $895-900 levels, which ignited a downside correction.
More importantly, there is a major bearish trend line forming with resistance at $860 on the 4-hours chart of ETH/USD. The pair recently failed to move above the trend line and declined below $850. It has breached the 23.6% Fib retracement level of the last wave from the $553 low to $897 high. The current trend is a bit bearish with signs of sellers around the $850-860 levels. On the downside, there is a major support near the $740 level. Moreover, the 50% Fib retracement level of the last wave from the $553 low to $897 high is near $725.

Therefore, the $725-740 zone is a decent support and the price may find bids near the stated levels. Below the mentioned $725, the price may once again come under bearish pressure. On the upside, the price has to close above $860 and $890 to gain upside momentum.
4-hours MACD – The MACD is currently moving lower in the bullish zone.
4-hours RSI – The RSI has moved below the 50 level.
Major Support Level – $725
Major Resistance Level – $860
Charts courtesy – SimpleFX


