
Reason to trust
How Our News is Made
Strict editorial policy that focuses on accuracy, relevance, and impartiality
Ad discliamer
Morbi pretium leo et nisl aliquam mollis. Quisque arcu lorem, ultricies quis pellentesque nec, ullamcorper eu odio.
Key Highlights
- Ethereum price remained under a lot of pressure this past week against the US Dollar and Bitcoin.
- There is a crucial bearish trend line formed on the daily chart of ETH/USD (data feed via SimpleFX), which is pushing the price down.
- The $8.00 handle may play a major role for the pair in the near term for the ETH buyers.
Ethereum price is under a lot of bearish pressure vs the US Dollar and Bitcoin, and ETH/USD may continue to trade lower going forward.
Ethereum Price Downside Pressure
It was a bad week for ETH price, as it declined heavily against the US Dollar and Bitcoin. There was an increase in the bearish pressure, igniting downside move in ETH/USD and ETH/BTC. The ETH/USD pair even traded towards $8.46 before correcting a few points. On the upside, there is a crucial bearish trend line formed on the daily chart of ETH/USD (data feed via SimpleFX).
It acted as a monster resistance area for the pair, and may continue to push it lower. It already corrected once, but found sellers near the 23.6% Fib retracement level of the last decline from the $12.75 high to $8.46 low. The chart does not support a bullish view at the moment, and it looks like the downside pressure is intact in the short term. Above the 23.6% Fib retracement level, the highlighted trend line resistance may prevent gains, and stop the upside move.
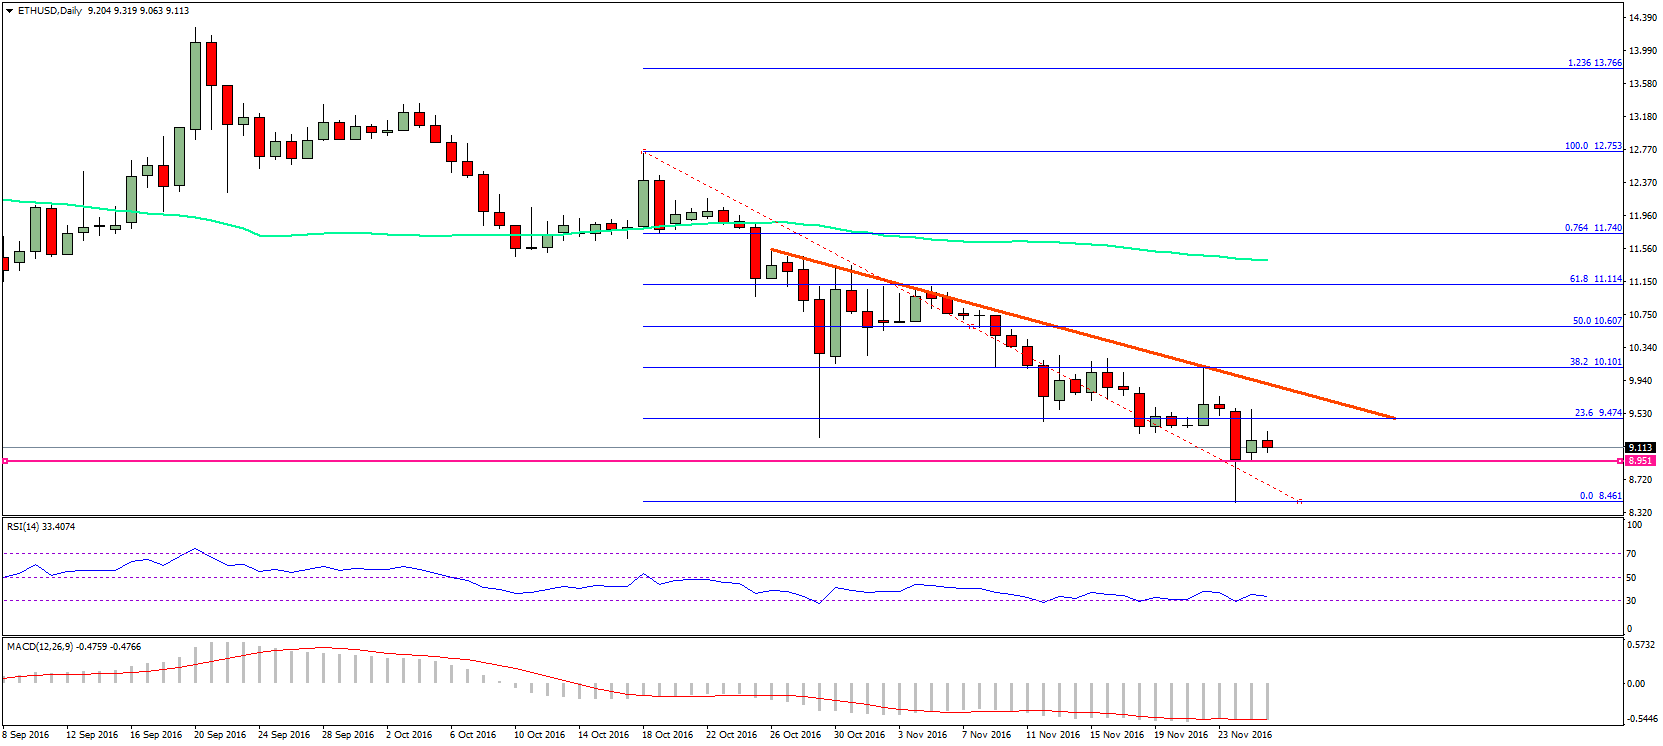
On the downside, the $8.50 level may act as a support. A break below it may push the price further down. The next important support is around the $8.20, and may prevent the downside move.
Daily MACD – The MACD is currently in the bearish zone, and not showing any signs of a recovery.
Daily RSI – The RSI is currently around the oversold area with no clear direction.
Major Support Level – $8.50
Major Resistance Level – $9.50
Charts courtesy – SimpleFX


