Reason to trust

How Our News is Made
Strict editorial policy that focuses on accuracy, relevance, and impartiality
Ad discliamer
Morbi pretium leo et nisl aliquam mollis. Quisque arcu lorem, ultricies quis pellentesque nec, ullamcorper eu odio.
Key Highlights
- ETH price surged higher by more than 60% this past week against the US Dollar to trade above $20.00.
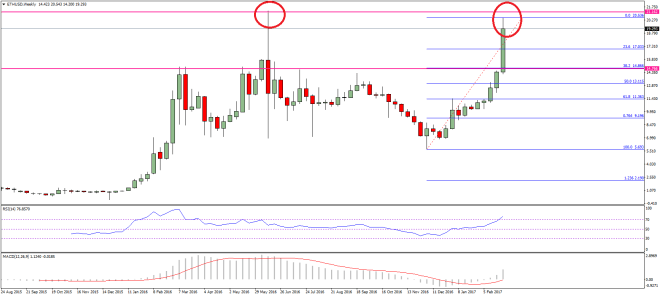
- There was a break above a major resistance area at $14.80 on the daily chart (data feed via SimpleFX) of ETH/USD.
- The pair traded above the $20.00 handle, and currently facing sellers just below the last major swing high of $21.00.
Ethereum price was super bullish this past week against the US dollar to trade above $18 and $20, but now ETH/USD faces a major resistance.
Ethereum Price Resistance
It was an amazing week for ETH price, as it managed to gain by more than $4-5 gainst the US dollar. It was also seen trading higher against the Bitcoin, as ETH/BTC broke the 0.0120BTC resistance to trade above 0.0150BTC. The best part this past week was a close above the all-important $14.80 resistance area. The stated area at $14.80 and $15.00 acted as a major hurdle on many occasions. A break above it was a good sign for Ethereum buyers in the short term.
The price surged higher and traded above the $20.00 handle. A new high was set near $20.53. However, the price failed to trade towards the all-time high of $21.16 (data feed via SimpleFX). It is showing some signs of retreat already and moving down. There is a high chance that the price might correct lower and trade towards $17.00 level in the near term.
On the downside, an initial support is near the 23.6% fib retracement level of the last wave from the $5.69 low to $20.53 high. However, the price is clearly in a bullish trend, so any pullbacks may be considered as a buying opportunity. So, if you are a buyer, wait for the right time.
Daily MACD – The MACD is now in the bullish zone with good signs.
Daily RSI – The RSI is into the overbought levels, but no sign of a pullback.
Major Support Level – $17.00
Major Resistance Level – $21.00
Charts courtesy – SimpleFX


