So that’s another day done in our bitcoin price trading efforts and – with it – another week complete. We’ve seen a whole host of different types of market conditions play out across the week, with consolidation followed by periods of strong volatility, bullish and bearish breaks and – unfortunately – a few chop outs along the way.
This is all in a day’s trading, however, and since we’re looking pretty likely to close out the week at a substantial net profit, we can’t complain. The odd stop loss hit isn’t a big deal – it’s what our stop losses are in place for, after all.
So, many reading will be excited about getting their weekend started, so we won’t spend too much time with this evening’s analysis. The chart below shows the action that played out during the session today out of Europe so – as we move into the US afternoon this evening, and beyond into the weekend – let’s get some key levels in place with which we can (hopefully) continue on our winning streak.
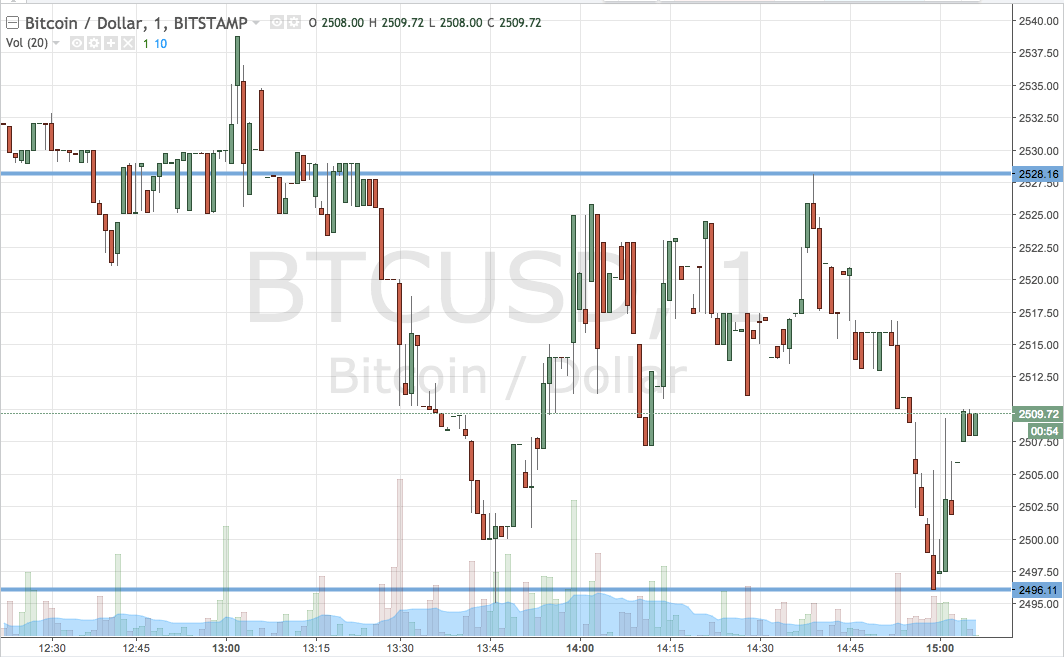
As ever, get a quick look at the bitcoin price chart to get an idea of what’s on right now. It’s a one-minute candlestick chart and it’s got our key range overlaid in blue.

As the chart shows, the range we’ve got in our sights for the evening session this evening is defined by support to the downside at 2496 and resistance to the upside at 2528.
Breakout only for now, so we’ll be looking at getting in long towards an immediate upside target of 2560 on a break above resistance (assuming price closes above that level) and, conversely, we’ll be in short on a close below support towards a target of 2465. A stop on both trades somewhere in the region of $10 either side of the position entry level will ensure we are taken out if markets reverse against us.
Charts courtesy of Trading View


