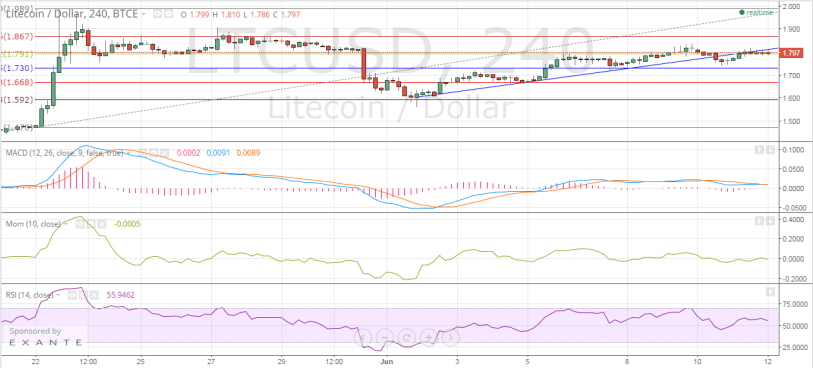
Litecoin bulls have made a great attempt in narrowing the recent losses as the price advanced roughly 1.5% to be trading at $1.797. I had mentioned in my previous analysis, Support Breached, Look to Exit! that market participants should build short positions on rise up to $1.785 by maintaining a stop-loss just above $1.795. Since the stop-loss has been triggered, it only makes sense to adopt a wait and watch strategy until convincing directional signals emerge.
 Image: https://www.tradingview.com/x/b1hmdEB6/
The 240-minute LTC-USD price chart indicates that the market may test the patience of the traders for a little longer before it chooses a direction.
Litecoin Chart Structure – A very interesting observation is that even though the price breached the upward sloping support line, bulls did not let the price register a lower bottom and, therefore, the overall higher top, higher bottom price chart is maintained. Litecoin rose to $1.820 and threatened to close above the previous support, but was brought down.
Fibonacci Retracements – Another point supporting the bullish mood is that Litecoin has reclaimed its previous zone of 38.2% Fibonacci retracement level of above $1.791. However, like before, sustenance is the key!
Moving Average Convergence Divergence – The MACD and the Signal Line are closely intertwined. The latest MACD value is 0.0091, extremely close to the Signal Line value of 0.0089.
Momentum – The insignificant Momentum value of -0.0005 cheers neither the bulls nor the bears.
Relative Strength Index – The strength of the buyers can be gauged from the latest RSI value of 55.9462.
Conclusion
The current situation is not clear enough to initiate a trade. While the chart structure represents a fair amount of bullishness, the technical indicators say otherwise. Wait for the market to choose a direction, and then take positions. Expect the ongoing sluggishness to end soon. I think that bulls may take control going ahead.


