Reason to trust

How Our News is Made
Strict editorial policy that focuses on accuracy, relevance, and impartiality
Ad discliamer
Morbi pretium leo et nisl aliquam mollis. Quisque arcu lorem, ultricies quis pellentesque nec, ullamcorper eu odio.
How times change! Just yesterday, I wrote an analysis Bears Have Been Smoked! and today, I am going to write about Litecoin’s frightening collapse from its 8-month high. Backed by strong momentum and positive mood, Litecoin jumped to $4.670, a level not seen since October 2014. But as the market got overheated, traders realized the need to lock in profits which led to a swift slide from the peak to a hit a low of $3.864.
Having erased a significant percentage of gains, Litecoin is trading up just 1.42% at $3.926.
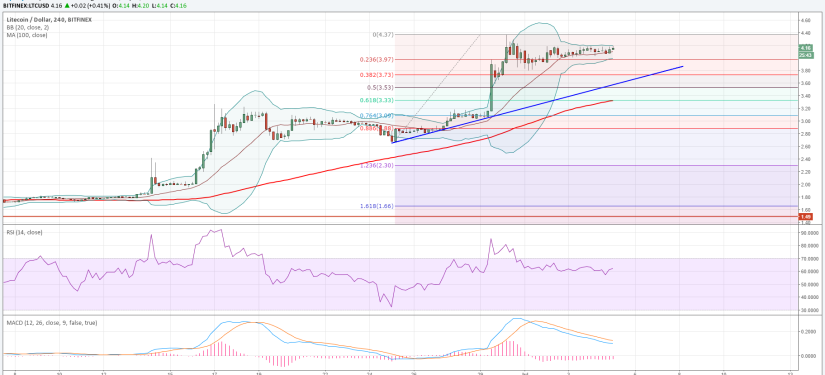
 Image: https://www.tradingview.com/x/fLRf1TgC/
The technical considerations derived from the 240-minute LTC-USD price chart lend credibility to the thought that more downside is possible in Litecoin.
Litecoin Chart Structure – The chart structure clearly tells that the cryptocurrency is facing a strong supply pressure and that it may fall to $3.500. The last 4 candles indicate that a bullish candle has been followed by a strong bearish candle, successive repetitions of which will make Litecoin a sell on rise security.
Moving Average Convergence Divergence – The Signal Line has rapidly gained on the MACD, leading to a fall in the Histogram value. The latest values of MACD, Signal Line and Histogram are 0.2859, 0.2599 and 0.0260 respectively. If the MACD crosses the Signal Line on the downside, then bulls will feel more pain.
Momentum – The Momentum reading has fallen strongly from north of 1.000 to 0.4665, following the price debacle.
Relative Strength Index – The 14-4h RSI value has eased from the overbought levels to 65.4998.
Conclusion
The recent correction in Litecoin is not an opportunity to buy as the cryptocurrency is still very expensive. The price has risen owing to heavy speculation and warrants a steep decline. I am expecting another bout of profit booking to drag the cryptocurrency. Long traders may consider liquidating their positions. Risk-averse traders are advised to sit out of this highly volatile environment.


