Reason to trust

How Our News is Made
Strict editorial policy that focuses on accuracy, relevance, and impartiality
Ad discliamer
Morbi pretium leo et nisl aliquam mollis. Quisque arcu lorem, ultricies quis pellentesque nec, ullamcorper eu odio.
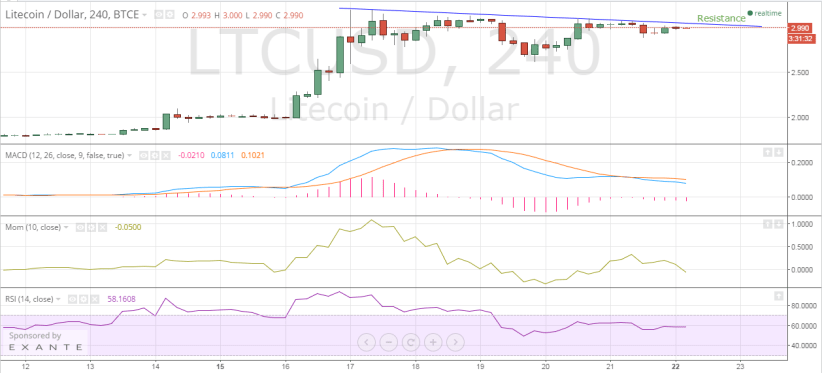
Litecoin had an extremely volatile weekend; the price first collapsed more than 15% from the previous observation of $3.085 to $2.614 before sharply rising up to pare most of the losses. However, Litecoin can be seen hitting a roadblock near $3.050.
Litecoin is currently trading near the resistance level, at $2.990.
 Image: https://www.tradingview.com/x/MZMFcUKC/
The 240-minute LTC-USD price chart tells that the cryptocurrency is trading near the strong supply zone and technical indicators are favoring a bearish outlook.
Litecoin Chart Structure – As can be seen from the above chart, the cryptocurrency has challenged the resistance line (marked) several times after the U-shaped recovery. However, the price has to close and sustain above $3.050 if hefty gains are to be realized.
Moving Average Convergence Divergence – The MACD indicator does not indicate a bullish undertone. While MACD has dropped to 0.0811, the Signal Line has plummeted to 0.1021, thereby pressing the Histogram value into the negative region. The latest Histogram value is -0.0210.
Momentum – Even as the price sustains at near resistance levels, the same confidence is not exuded by the Momentum reading, which has retracted into the negative zone. The current Momentum reading is -0.0500.
Relative Strength Index – However, in a major deviation from the above two technical indications, the 14-4h RSI is reflecting a strong buying interest in Litecoin. The latest value comes in pretty strong at 58.1608.
Conclusion
2 out of 3 indicators convey that Litecoin lacks the momentum to pierce the resistance zone and add more gains. The chart structure says that $3.050 will prove to be a major roadblock for the cryptocurrency. Therefore, I would suggest that Litecoin be shorted at the current level or up to a rise of $3.020 while maintaining a strict stop-loss just above $3.050. The target for this trade is at $2.600. I am expecting volatility to rock the market several times in the coming sessions.


