Reason to trust

How Our News is Made
Strict editorial policy that focuses on accuracy, relevance, and impartiality
Ad discliamer
Morbi pretium leo et nisl aliquam mollis. Quisque arcu lorem, ultricies quis pellentesque nec, ullamcorper eu odio.
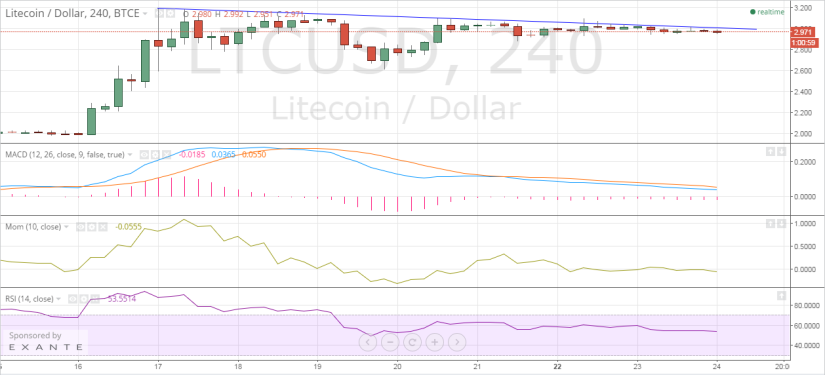
Litecoin continues to tire out below the previous resistance level of $3.050 but, unfortunately, it has made no significant attempt which would induce fear in the hearts of short sellers. The price trades in an extremely tight range near the highs, making it difficult for the trading community to place their positions at low risks.
Litecoin is currently trading down 1.58% at $2.971 and has hit a low of $2.950.
 Image: https://www.tradingview.com/x/5zZb9buJ/
Technical analysis implemented on the 240-minute LTC-USD price chart indicates that the traders must remain patient as a breakout/breakdown is around the corner.
Litecoin Chart Structure – Apart from the 1.6% decline, there is not much difference in the chart structure in the past 24 hours. During this narrow consolidation phase, the price action has been limited between $2.950 and $3.025. The resistance level has shifted down to $3.000 (see the downward resistance line).
Moving Average Convergence Divergence – The MACD, the Signal Line and the Histogram show no significant variation from yesterday’s stance. MACD is still below the Signal line and as a result, the Histogram has failed to rise above 0 level. The latest MACD, Signal Line and Histogram values are 0.0365, 0.0550 and -0.0185 respectively.
Momentum – The Momentum indicator has been pushed into the negative region as bulls make no attempt to take the price higher. The updated Momentum reading is -0.0555.
Relative Strength Index – The 14-4h RSI indicator tells of a somewhat neutral bias with a value of 53.5514.
Conclusion
Litecoin remains under pressure at higher levels and must cross and sustain above $3.000 in order to avoid a meltdown. As the resistance has shifted to a lower level, it is advised that short positions be created at the current level or higher, by maintaining a stop-loss just above the resistance line. Expect good price action in the market this week.


