Reason to trust

How Our News is Made
Strict editorial policy that focuses on accuracy, relevance, and impartiality
Ad discliamer
Morbi pretium leo et nisl aliquam mollis. Quisque arcu lorem, ultricies quis pellentesque nec, ullamcorper eu odio.
Litecoin manages to stay afloat, thanks to the rebound in Bitcoin, and can be seen testing an important short-term resistance. At $2.844, Litecoin also offers a very low-risk shorting opportunity.
But before we go all bearish on Litecoin, let us visit the latest technical indications for further clarity.
Here is a lowdown of the key technical aspects from the daily LTC-USD price chart.

Image: https://www.tradingview.com/x/WQ976LHZ/
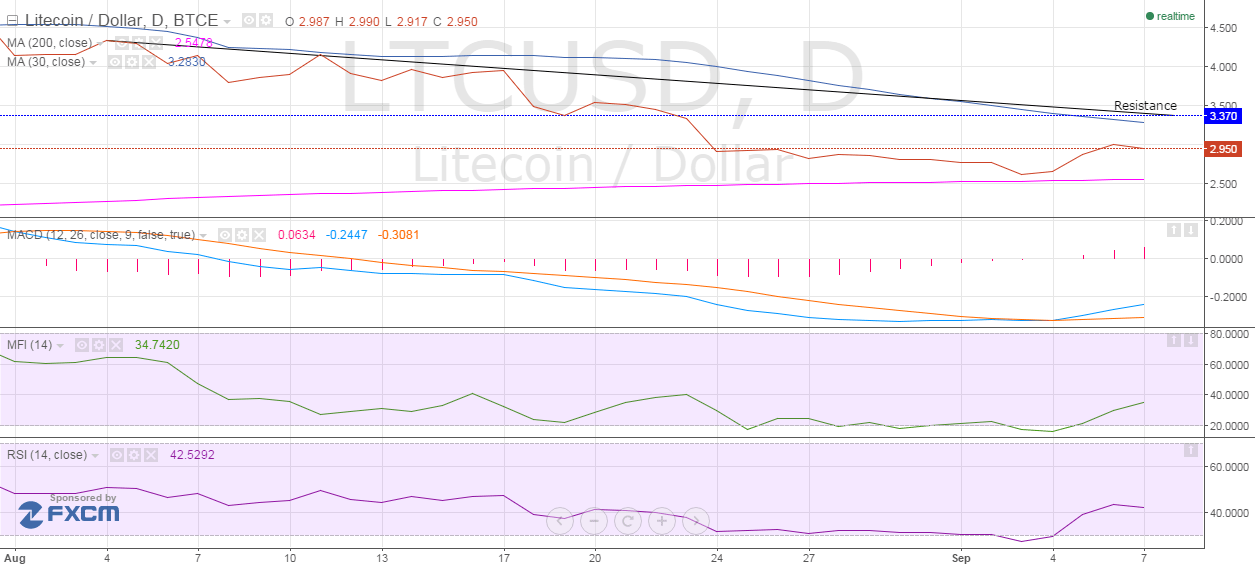
Litecoin Chart Structure – From the above chart, it is clear that Litecoin has been trading in a contracting channel since September 7. The cryptocurrency is now at the higher end of this range, which tempts us to build short positions by placing a tight stop-loss (closing basis) above the downward resistance trendline. For a stronger confirmation of the bullish bias, wait for a close above $2.950.
Moving Averages – On a positive note, Litecoin is comfortably trading above both the 12-day SMA of $2.8269 and the 30-day SMA of $2.8419. If the cryptocurrency manages to hold these as the floor, the resistance will be breached.
Moving Average Convergence Divergence – The Histogram maintains its positive stead, helped by a rising MACD. The latest value of Histogram is 0.0260 while that of MACD is -0.0864.
Money Flow Index – The 14-day MFI paints a neutral picture with a value of 52.3235.
Relative Strength Index – The RSI is tracing the price action bit-by-bit. Its current value of 44.1592 speaks about the underlying pessimism.
Conclusion
Litecoin is trading in a range which gives market participants an opportunity to make low-risk trading decisions. But, the trading community should also heed the slightly positive technical signals which may play spoilsport for the short-sellers.
Bitcoin markets should also be closely watched. The leading cryptocurrency has remained highly resilient but is repeatedly entering into choppy trades.
Trade with only light positions on the short side. Immediately cover all the shorts if the price closes above the resistance.


