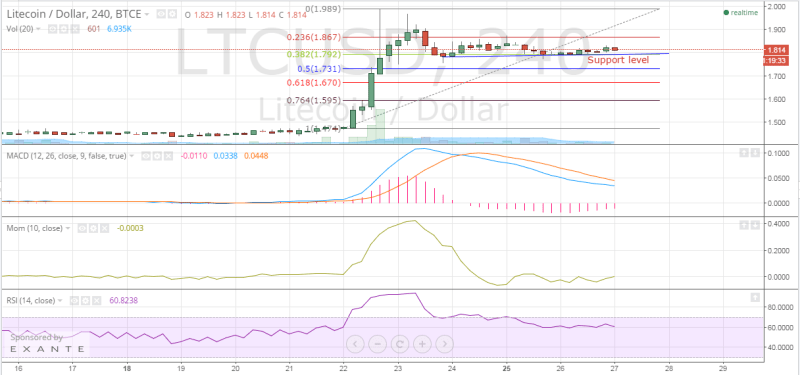
Litecoin bulls have extended their resting period and wait for market triggers to prompt the next leg of this rally. In the past 24 hours, the virtual currency has traded in a very narrow band of $1.790-1.834 as bears fail to exert enough pressure to bother the comfortably placed bulls.
Litecoin was last trading up 0.7% at $1.814.
 Image: https://www.tradingview.com/x/CMa2r2Tk/
Technical analysis of the 240-minute Litecoin/Dollar chart reveals that the current price level is in close proximity to a support level, and any failure to hold that may result in a swift decline in the valuation.
Litecoin Price Chart – In its present consolidation, Litecoin seems to be narrowing its range (check the chart above). The support level comes in at $1.792 while the resistance level is at $1.845. In case, the support is breached, market participants may witness a decline to $1.700-odd levels.
Fibonacci Retracements – The technical support level effortlessly coincides with the 38.2% Fibonacci retracement level, thereby increasing its importance. The next two Fibonacci support levels are the 50% retracement ($1.731) and the 61.8% retracement ($1.670).
Moving Average Convergence Divergence – The MACD and the Signal Line continue with their downtrend falling to values of 0.338 and 0.448 respectively. The Histogram has also failed to rise above the 0 level as the latest value comes in at -0.0110.
Momentum – The Momentum indicator fails to provide any significant clues regarding the future course of action as the value struggles to deviate considerably beyond 0; the current Momentum reading is -0.0003.
Relative Strength Index – Even as bulls breathe easy, they have made sure not to let the strength weaken. The 14-4h RSI value is strongly in favor of buyers at 60.8238.
Conclusion
Mr. Market offers no decisive clues on direction, and therefore, a wait and watch approach should be continued with. Unnecessarily trading as the range narrows may lead to huge losses. I do not expect huge upside from the current level this week.


