Reason to trust

How Our News is Made
Strict editorial policy that focuses on accuracy, relevance, and impartiality
Ad discliamer
Morbi pretium leo et nisl aliquam mollis. Quisque arcu lorem, ultricies quis pellentesque nec, ullamcorper eu odio.
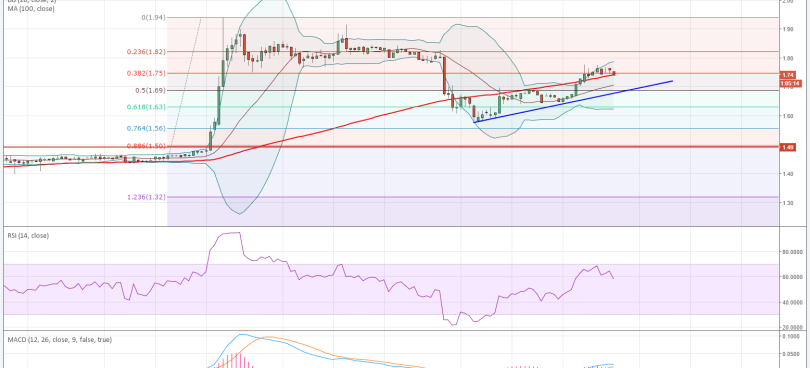
Litecoin’s steady advance has brought the price up to the highest level of June i.e. at $1.800, and it may go even higher as bulls tighten the noose on the bears. In my previous analysis titled, Buy, But Don’t Forget This!, I mentioned that Litecoin is a buy on dips candidate; that statement holds for today as well!
Litecoin is currently trading up 2.10% at $1.797.
 Image: https://www.tradingview.com/x/zuASQULW/
Litecoin’s chart structure is strongly bullish, however, the technical indicators reflect a mixed outlook. A 240-minute LTC-USD price chart has been analyzed here.
Litecoin Chart Structure – Litecoin’s higher top, higher bottom chart structure remains comfortably strong as the price scales new highs. The cryptocurrency will now face Resistance at $1.820 while the upward sloping support line will act as a cushion. From today’s perspective, the support comes in at $1.740.
Fibonacci Retracements – The optimism surrounding the cryptocurrency has lifted the price above the strong resistance posed by the 38.2% Fibonacci retracement level of $1.789. Sustaining above this level may lead to hefty gains for Litecoin.
Moving Average Convergence Divergence – The MACD and the Signal Line are still in close contact with each other, but unlike yesterday, MACD has crossed the Signal Line on the upside. As a result, the latest Histogram value has turned positive at 0.0016.
Momentum – The Momentum indicator is also barely positive at 0.0218, which fails to inspire much confidence.
Relative Strength Index – The strength indicator projects a strong bullish undertone with a value of 64.2478.
Conclusion
Market participants should continue to buy Litecoin on dips but strictly follow the stop-losses. As the price heads higher, expect bouts of volatility to rock the market. Partial profit booking is also advised for those unwilling to put big profits at risk. Litecoin has started this week on a positive note, and I expect the momentum to stay that way for the next 36-48 hours.


