
Reason to trust
How Our News is Made
Strict editorial policy that focuses on accuracy, relevance, and impartiality
Ad discliamer
Morbi pretium leo et nisl aliquam mollis. Quisque arcu lorem, ultricies quis pellentesque nec, ullamcorper eu odio.
- Ripple price remained in a bearish zone and declined below the key $0.3060 support against the US dollar.
- Bears remain in action as they managed to push the price below the $0.3000 support.
- Yesterday’s highlighted important bearish trend line is intact with resistance at $0.3035 on the hourly chart of the XRP/USD pair (data source from Kraken).
- The pair is currently correcting higher, but bears remain in control below $0.3040 and $0.3060.
Ripple price declined heavily and broke many supports against the US Dollar and bitcoin. XRP/USD is currently in a strong downtrend and it could continue to move down towards $0.2920 or $0.2800.
Ripple Price Analysis
In the past few hours, there was a strong decline in ripple price from the $0.3100 resistance against the US Dollar. The XRP/USD pair failed to hold the $0.3080 and $0.3060 support levels and entered a bearish zone. There was a sharp decline below the $0.3040 support and the price settled well below the 100 hourly SMA. Sellers gained control and pushed the price below the $0.3000 support as well.
A new weekly low was formed at $0.2980 and the price is currently correcting higher. The price moved above the $0.3000 support level. Moreover, it cleared the 23.6% Fib retracement level of the recent decline from the $0.3065 high to $0.2980 low. However, there are many hurdles for buyers near the $0.3040 level. An initial resistance is $0.3025 and the 50% Fib retracement level of the recent decline from the $0.3065 high to $0.2980 low. More importantly, yesterday’s highlighted important bearish trend line is intact with resistance at $0.3035 on the hourly chart of the XRP/USD pair.
If there is an upside break above the $0.3035 level, the price could trade towards the key $0.3060 resistance. The 100 hourly simple moving average is also positioned near the $0.3070 level to act as a barrier for buyers. Therefore, if the price corrects higher, it is likely to face a strong selling interest near the $0.3035 or $0.3060 level.
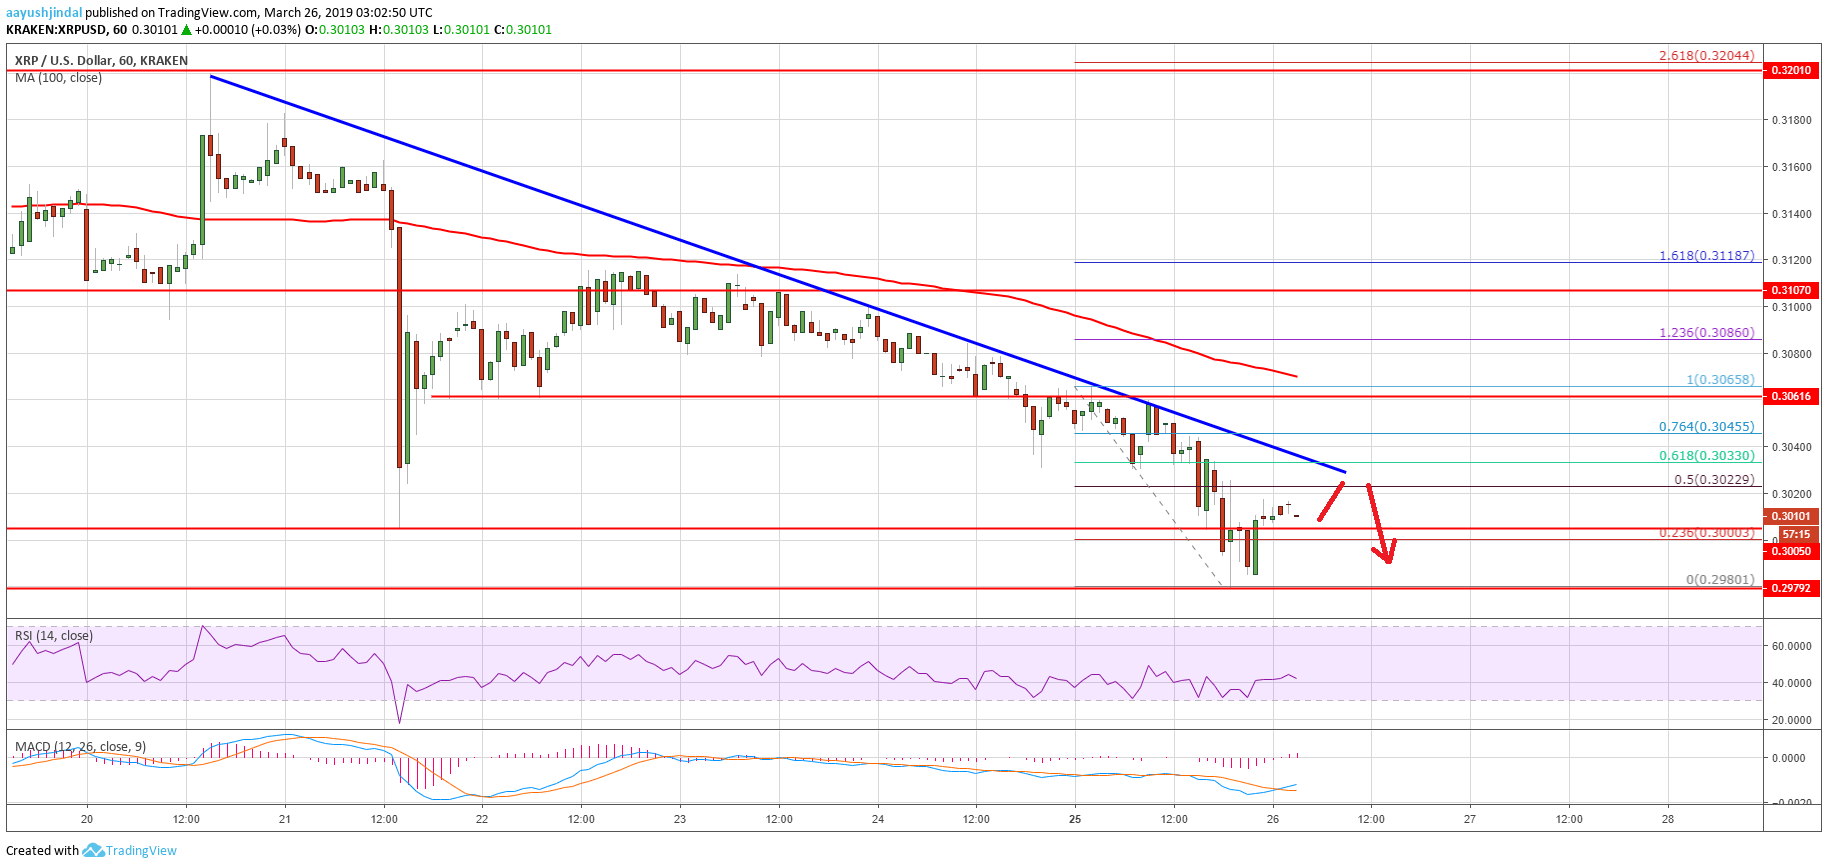
Looking at the chart, ripple price is under a lot of selling pressure and it is in a strong downtrend below $0.3080. On the downside, if the price declines below the recent low of $0.2980, there could be a sharp drop towards $0.2920 or $0.2880. Besides, if sellers remain in action, there are chances of a test of the $0.2800 support level. On the upside, only a close above $0.3060 and the 100 hourly SMA might decrease selling pressure.
Technical Indicators
Hourly MACD – The MACD for XRP/USD is slowly moving in the bullish zone.
Hourly RSI (Relative Strength Index) – The RSI for XRP/USD is currently above the 40 level, but below 50.
Major Support Levels – $0.3000, $0.2980 and $0.2920.
Major Resistance Levels – $0.3035, $0.3060 and $0.3070.


