
Reason to trust
How Our News is Made
Strict editorial policy that focuses on accuracy, relevance, and impartiality
Ad discliamer
Morbi pretium leo et nisl aliquam mollis. Quisque arcu lorem, ultricies quis pellentesque nec, ullamcorper eu odio.
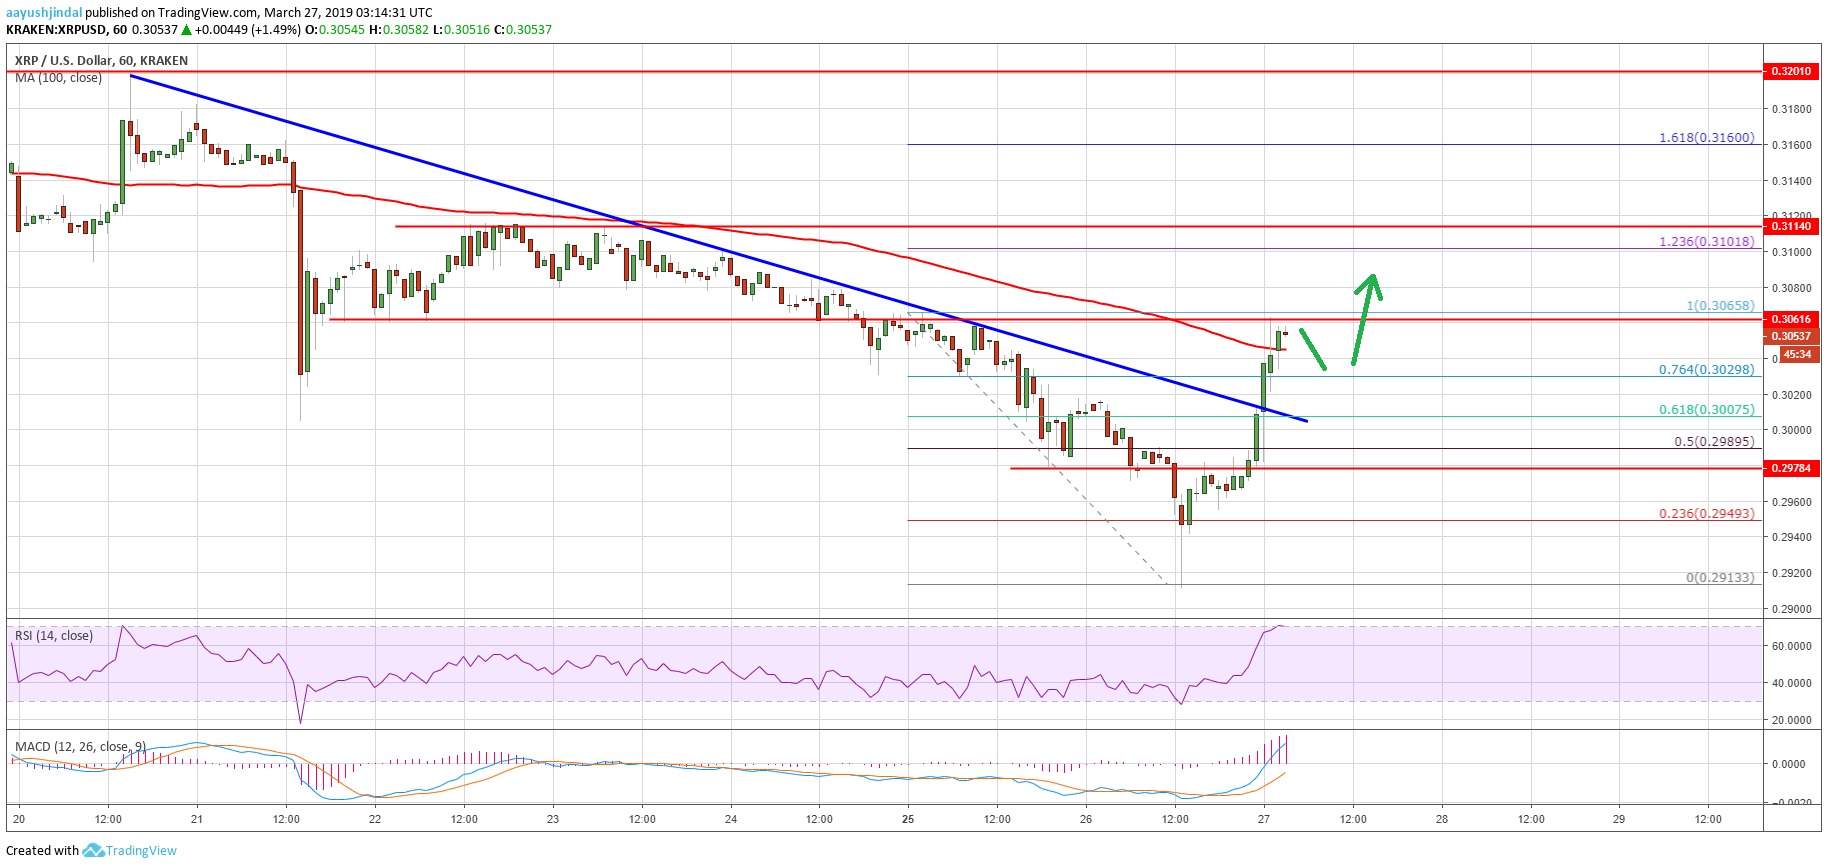
- Ripple price tested the next key support near $0.2920 and later bounced back against the US dollar.
- Bulls took control and pushed the price above the $0.2980 and $0.3000 resistance levels.
- This week’s followed key bearish trend line was breached with resistance at $0.3010 on the hourly chart of the XRP/USD pair (data source from Kraken).
- The pair rallied above the $0.3020 resistance and it may even climb above $0.3065 and $0.3080.
Ripple price traded to new weekly lows before rebounding higher against the US Dollar and bitcoin. XRP/USD settled above $0.3000, with a bullish angle and it may accelerate above $0.3065.
Ripple Price Analysis
Yesterday, we saw a nasty decline below $0.3000 in ripple price against the US Dollar and discussed about more losses. The XRP/USD pair did extend losses below the $0.3000 and $0.2950 support levels. It tested the $0.2920 support area, where buyers emerged. A swing low was formed near $0.2913 and later the price started a sharp upward move. Buyers came into action and pushed the price above the $0.2980 and $0.3000 resistance levels.
The upward move was strong as the price climbed above the 61.8% Fib retracement level of the last decline from the $0.3065 high to $0.2913 low. Moreover, this week’s followed key bearish trend line was breached with resistance at $0.3010 on the hourly chart of the XRP/USD pair. The pair is now trading nicely above the 76.4% Fib retracement level of the last decline from the $0.3065 high to $0.2913 low. It is testing the $0.3065 swing high and trading above the 100 hourly simple moving average.
In the short term, there could be a downside correction towards the $0.3030 or $0.3010 support levels. On the upside, a break above the $0.3065 might open the doors for more gains. The next key resistance is near $0.3100. It represents the 1.236 Fib extension retracement level of the last decline from the $0.3065 high to $0.2913 low.
Looking at the chart, ripple price clearly recovered nicely from the $0.2920 support level. A close above the $0.3000 barrier is positive and has opened the doors for more gains. However, it won’t be easy for buyers to clear the $0.3065 and $0.3080 levels. Once they succeed, the price is likely to surge above the $0.3100 resistance level. On the downside, there are many supports near the $0.3030 and $0.3010 levels, followed by the key $0.3000 support.
Technical Indicators
Hourly MACD – The MACD for XRP/USD is placed heavily in the bullish zone.
Hourly RSI (Relative Strength Index) – The RSI for XRP/USD climbed higher sharply and moved above the 65 level.
Major Support Levels – $0.3030, $0.3010 and $0.3000.
Major Resistance Levels – $0.3065, $0.3080 and $0.3100.


