Reason to trust
How Our News is Made
Strict editorial policy that focuses on accuracy, relevance, and impartiality
Ad discliamer
Morbi pretium leo et nisl aliquam mollis. Quisque arcu lorem, ultricies quis pellentesque nec, ullamcorper eu odio.
Key Highlights
- Ripple price recently tested the $0.4600 resistance where sellers emerged against the US dollar.
- There is a connecting bullish trend line forming with support near $0.4500 on the hourly chart of the XRP/USD pair (data source from Kraken).
- The pair may perhaps continue to find buyers near the $0.4500 and $0.4450 levels in the near term.
Ripple price is trading in a positive zone against the US Dollar and Bitcoin. XRP/USD remains buy on dips near the $0.4450 and $0.4400 support levels.
Ripple Price Analysis
After trading as low as $0.4478 recently, ripple price started an upside correction against the US Dollar. The XRP/USD pair moved above the $0.4500 and $0.4550 resistance levels. There was a decent break above the 23.6% Fib retracement level of the recent decline from the $0.4740 high to $0.4478 low. However, the price failed to break the key resistance area near $0.4600.
Moreover, the price failed to clear the 50% Fib retracement level of the recent decline from the $0.4740 high to $0.4478 low. The price retreated from the $0.4600 resistance and traded below the $0.4550 level. At the moment, the price is testing the $0.4520 level and the 100 hourly simple moving average. More importantly, there is a connecting bullish trend line forming with support near $0.4500 on the hourly chart of the XRP/USD pair. If the pair dips from the current levels, it is likely to find bids near the $0.4500 and $0.4450 levels in the near term. Below $0.4450, the next support awaits near $0.4410.
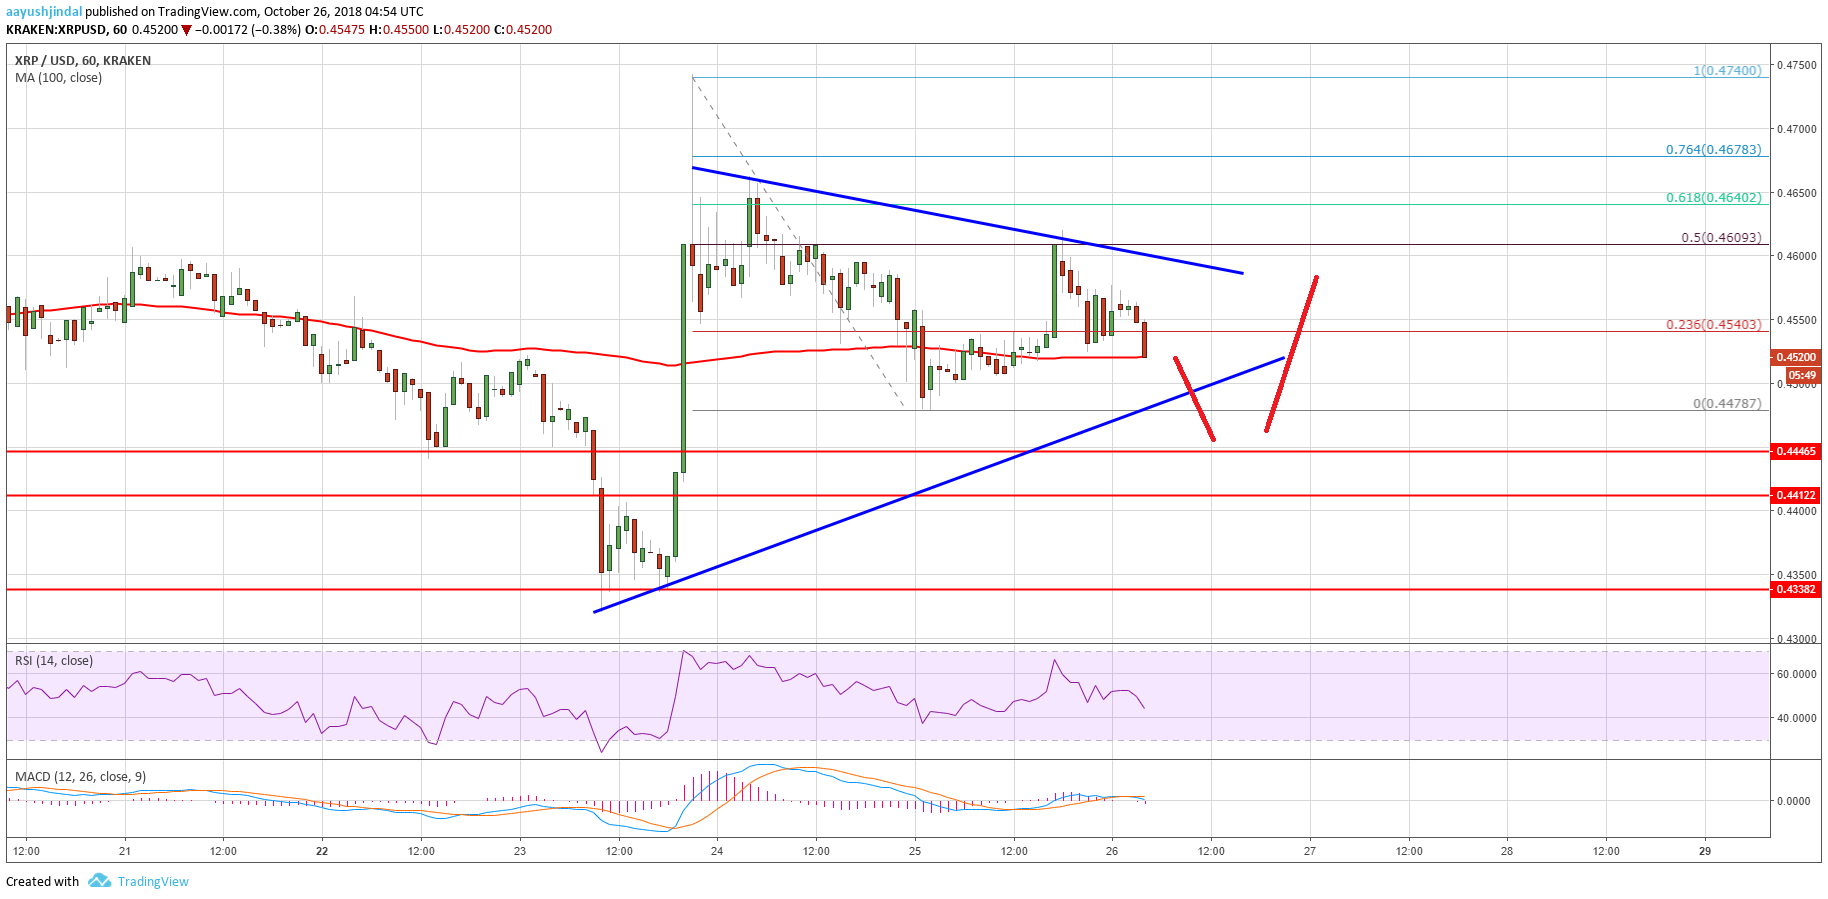
Looking at the chart, ripple price is trading nicely in a positive zone above the $0.4400 pivot level. Once there is a break above the $0.4600 resistance, the price could climb back towards the $0.4740 and $0.4800 levels.
Looking at the technical indicators:
Hourly MACD – The MACD for XRP/USD is slowly moving in the bearish zone.
Hourly RSI (Relative Strength Index) – The RSI for XRP/USD is currently just below the 50 level.
Major Support Level – $0.4450
Major Resistance Level – $0.4600