
Reason to trust
How Our News is Made
Strict editorial policy that focuses on accuracy, relevance, and impartiality
Ad discliamer
Morbi pretium leo et nisl aliquam mollis. Quisque arcu lorem, ultricies quis pellentesque nec, ullamcorper eu odio.
- Ripple price is consolidating above the $0.1850 and $0.1880 support levels against the US dollar.
- XRP could start a larger rally if it clears the main $0.2000 resistance area.
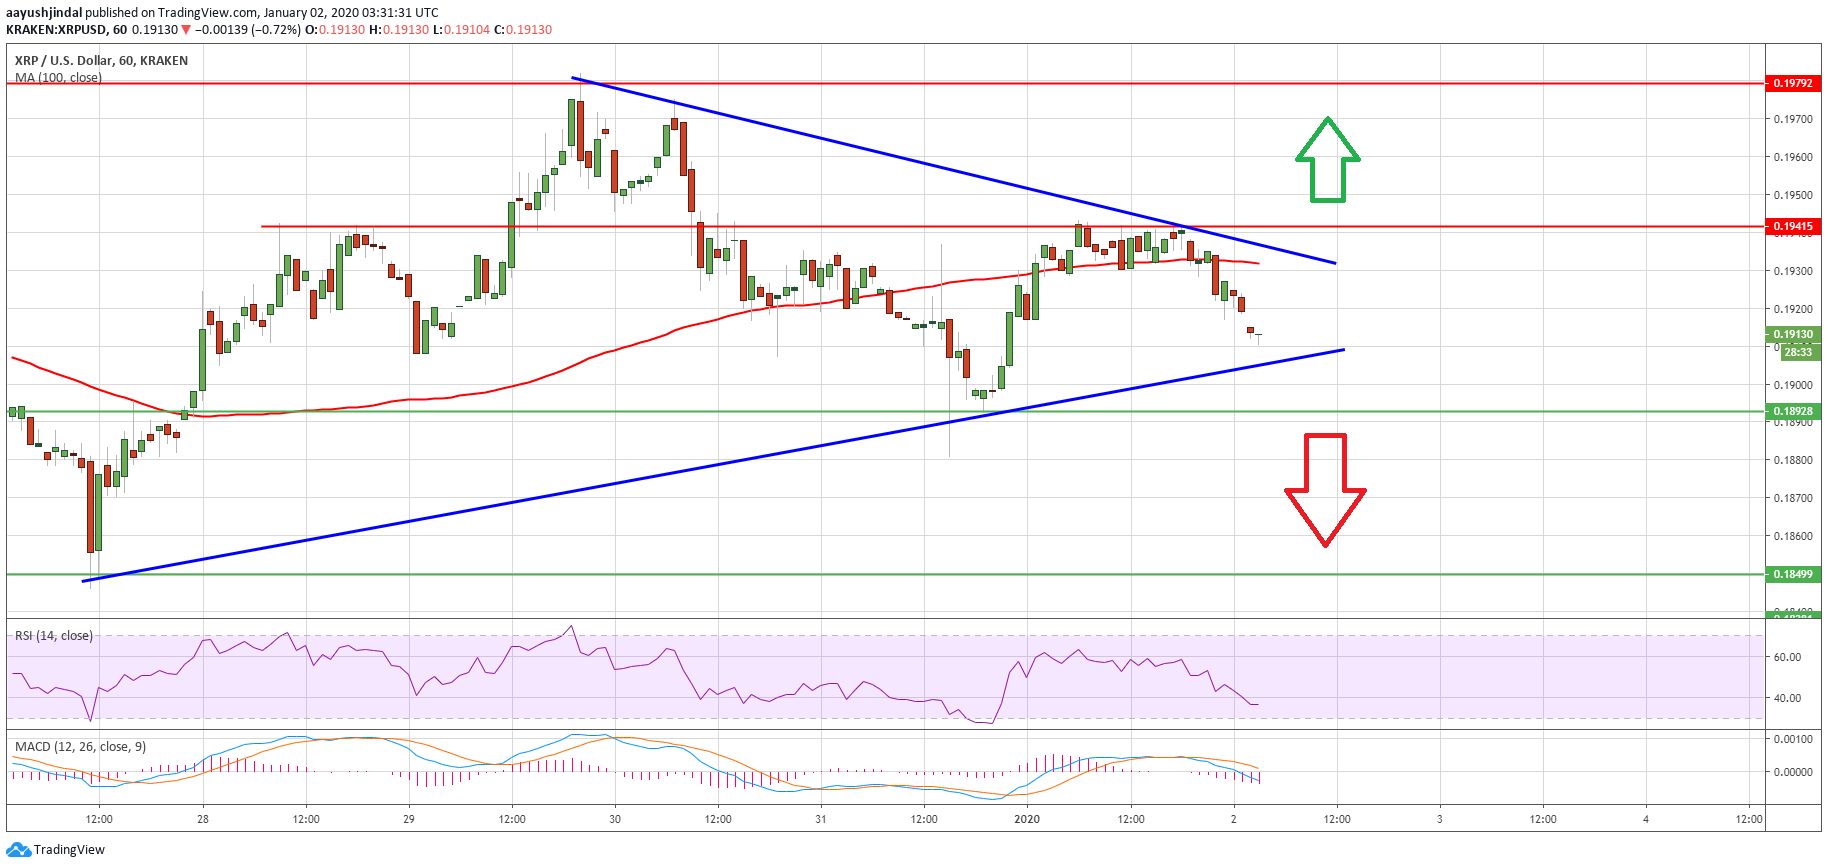
- There is a major breakout pattern forming with resistance near $0.1930 on the hourly chart of the XRP/USD pair (data source from Kraken).
- Conversely, the pair might collapse if it breaks the $0.1850 support area.
Ripple price seems to be preparing for a larger breakout against the US Dollar, similar to bitcoin. XRP price must settle above $0.2000 to start a strong rally.
Ripple Price Analysis
In the past few days, ripple price made a couple of attempts to surpass the $0.2000 resistance against the US Dollar. However, XRP price failed to gain momentum above $0.1980 and declined recently.
Moreover, the price settled below the $0.1940 pivot level and the 100 hourly simple moving average. The last swing high was formed $0.1942 and the price is now trading with a bearish angle.
It is trading below the 23.6% Fib retracement level of the upward move from the $0.1881 low to $0.1942 high. On the downside, there are key supports forming near the $0.1900 and $0.1880 levels.
Besides, the 50% Fib retracement level of the upward move from the $0.1881 low to $0.1942 high is also near the $0.1910 level to provide support. Therefore, the bears need to push the price below the $0.1900 and $0.1880 levels to start a substantial decline.
The main support for ripple is near the $0.1850 level, below which there is a risk of a larger breakdown. In the mentioned bearish case, the price could accelerate towards the $0.1720 and $0.1650 support levels.
Conversely, the bulls could make another attempt to surpass the $0.1980 and $0.2000 resistance levels. If they succeed, the price will most likely start a larger rally above $0.2050.
In the bullish scenario, the price could surge towards the $0.2150 and $0.2200 resistance levels. More importantly, it bitcoin gains pace above $7,500 and Ethereum breaks $138, ripple might also gain a strong bullish momentum.
Looking at the chart, ripple price seems to be confined in a range below the main $0.1980 and $0.2000 resistance levels. As long as there is no close below $0.1850, the price is likely to aim a crucial bullish break above the $0.2000 barrier in the coming days.
Technical Indicators
Hourly MACD – The MACD for XRP/USD is currently gaining pace in the bearish zone.
Hourly RSI (Relative Strength Index) – The RSI for XRP/USD is currently well below the 50 level, with a bearish angle.
Major Support Levels – $0.1900, $0.1880 and $0.1850.
Major Resistance Levels – $0.1940, $0.1900 and $0.2000.


