Reason to trust
How Our News is Made
Strict editorial policy that focuses on accuracy, relevance, and impartiality
Ad discliamer
Morbi pretium leo et nisl aliquam mollis. Quisque arcu lorem, ultricies quis pellentesque nec, ullamcorper eu odio.
Ripple is showing a few positive signs above the $0.2300 support against the US Dollar. XRP price is likely to accelerate higher if it clears the $0.2425 resistance area.
- Ripple price is slowly rising after forming a double bottom pattern near the $0.2240 level against the US dollar.
- The price is now trading above the $0.2300 and $0.2320 levels.
- There was a break above a major bearish trend line with resistance near $0.2240 on the hourly chart of the XRP/USD pair (data source from Kraken).
- The price is now facing a couple of key hurdles near the $0.2425 and $0.2480 levels.
Ripple Price Could Continue Higher
Yesterday, we discussed a possible a double bottom pattern for ripple near the $0.2240 level. XRP price remained well bid above the $0.2240 and $0.2250 levels and recently started a decent increase.
The price is up around 2% and it surpassed the $0.2300 resistance level. Besides, there was a break above a major bearish trend line with resistance near $0.2240 on the hourly chart of the XRP/USD pair.
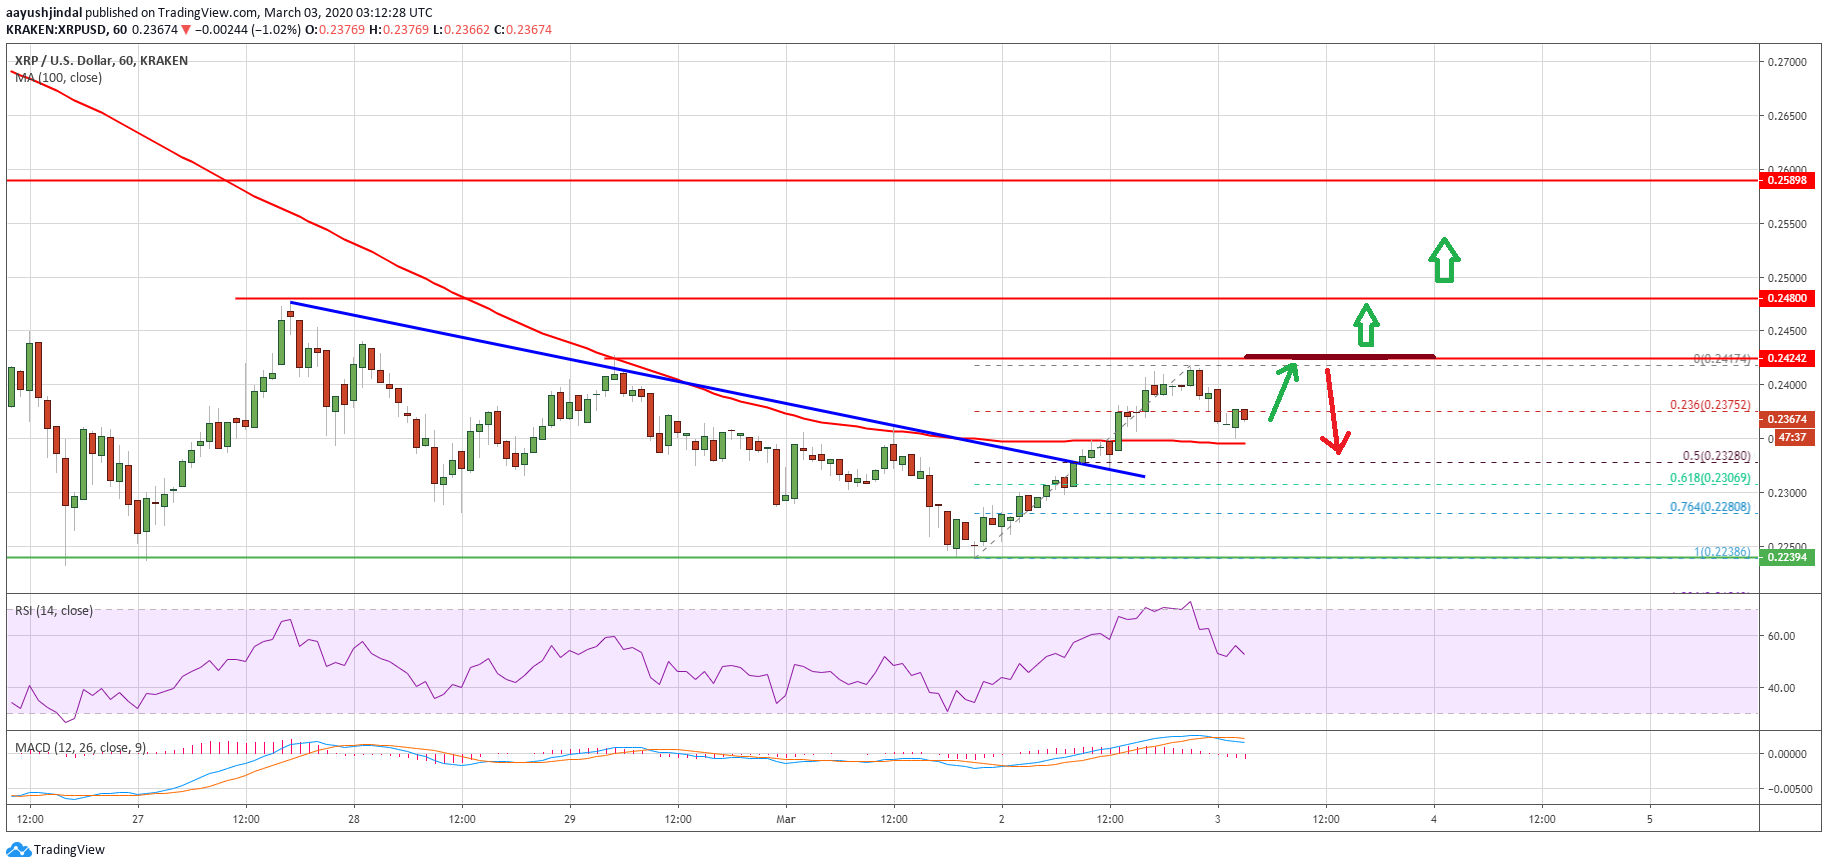
The pair is now trading well above the $0.2320 level and the 100 hourly simple moving average. A high is formed near $0.2417 and ripple price is currently correcting lower. It traded below the $0.2400 level, plus the 23.6% Fib retracement level of the upward move from the $0.2238 low to $0.2417 high.
An initial support on the downside is near the $0.2345 and the 100 hourly simple moving average. The next key support is visible near the $0.2330 level since it is close to the 50% Fib retracement level of the upward move from the $0.2238 low to $0.2417 high.
Therefore, ripple is likely to remain well supported on the downside near the $0.2330 area. On the upside, an initial resistance is near the $0.2425 zone.
To start a strong increase, the bulls need to gain momentum above the $0.2425 resistance level. A successful break above $0.2325 and $0.2480 could open the doors for a strong rally. The next key resistance is near the $0.2580 and $0.2600 levels.
Fresh Decline?
If ripple struggles to continue above the $0.2425 and $0.2480 resistance levels, there are chances of a fresh decline. A clear break below $0.2330 and the 100 hourly SMA might put pressure on the bulls.
On the downside, the main support is near $0.2300, below which the price may perhaps break the $0.2240 double bottom support and extend its decline towards $0.2200.
Technical Indicators
Hourly MACD – The MACD for XRP/USD is slowly moving into the bearish zone.
Hourly RSI (Relative Strength Index) – The RSI for XRP/USD is currently correcting lower towards the 50 level.
Major Support Levels – $0.2330, $0.2300 and $0.2240.
Major Resistance Levels – $0.2425, $0.2480 and $0.2580.