

Rubycoin Price Key Highlights
- Rubycoin price after a decent bullish run looks like started a short-term correction lower.
- There is a bullish trend line formed on the hourly chart, which is likely to act as a support area if the price moves lower from the current levels.
- A major support area around 0.000205BTC is formed where there is a chance of buyers appearing.
Rubycoin price is correcting lower after a solid bullish run, and might be heading towards a major support area.
Buying Dips?
The Rubycoin price as highlighted recently managed to trade higher after breaking a major bearish trend line on the hourly chart. The price found sellers around the 76.4% Fib retracement level of the last leg from 0.000365BTC to 0.000100BTC, and started correcting lower. The price is currently trading near the 38.2% Fib retracement level of the last leg from 0.000100BTC to 0.000309BTC. The worst thing to note from the chart is the fact that the price is now below the 100 hourly simple moving average. So, there is a possibility that the price might head further lower from the current levels.
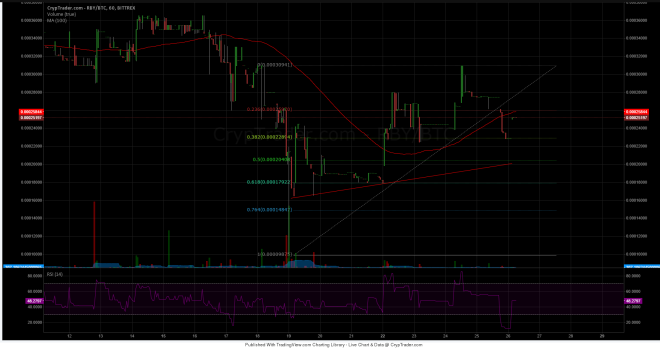

There is a support trend line formed on the hourly chart, which is coinciding with the 50% Fib retracement level. It means the 0.000205BTC area is a major hurdle for sellers. They might struggle to break the stated level in the near term. Only a break and close below the trend line and support area could negate the buying dips theory and call for more losses.
If the price starts to move higher one more time from the current or lower levels, then the first resistance for buyers may be around 0.000280BTC followed by 0.000309BTC.
Intraday Support Level – 0.000205BTC
Intraday Resistance Level – 0.000280BTC
The RSI is just around the 50 level, so let’s see if the can move above it or not.
Charts courtesy of Cryptrader