Rubycoin Price Technical Analysis
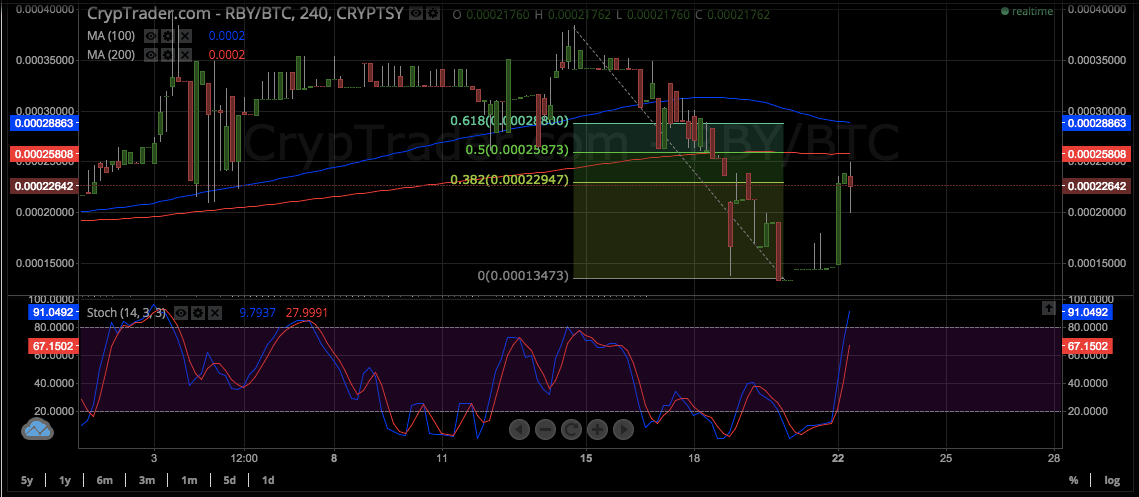
- Rubycoin price is in the middle of a correction but it looks like the pullback is already over, as the 50% Fibonacci retracement level is holding as strong resistance.
- This retracement level lines up with a former support level, making it an area of interest and likely resistance.
Rubycoin price has made a sharp selloff recently and might be done with its retracement from the move, allowing sellers to regain control.
Spinning top at resistance?
A spinning top reversal candlestick has formed on the latest pullback, hinting that price could turn a corner. A candle closing below the low of that spinning top might be enough confirmation that bears are returning.
For now, the 100 SMA is above the 200 SMA so the path of least resistance is still to the upside. A higher pullback could last until the 61.8% Fib, which is near the 100 SMA dynamic inflection point. A break above that area could lead to a climb up to the swing high at 0.000380BTC.

On the other hand, a return in selling pressure could lead to a drop back to the previous lows at 0.000135. Stochastic is still heading north though, indicating that there’s a bit of bullish momentum left for a larger pullback.
Once the oscillator turns from the overbought area, sellers could reestablish their short positions and might even take rubycoin price down to fresh lows.
Intraday support level – 0.000200BTC
Intraday resistance level – 0.000270BTC
Charts from CrypTrader.com


