Rubycoin Price Key Highlights
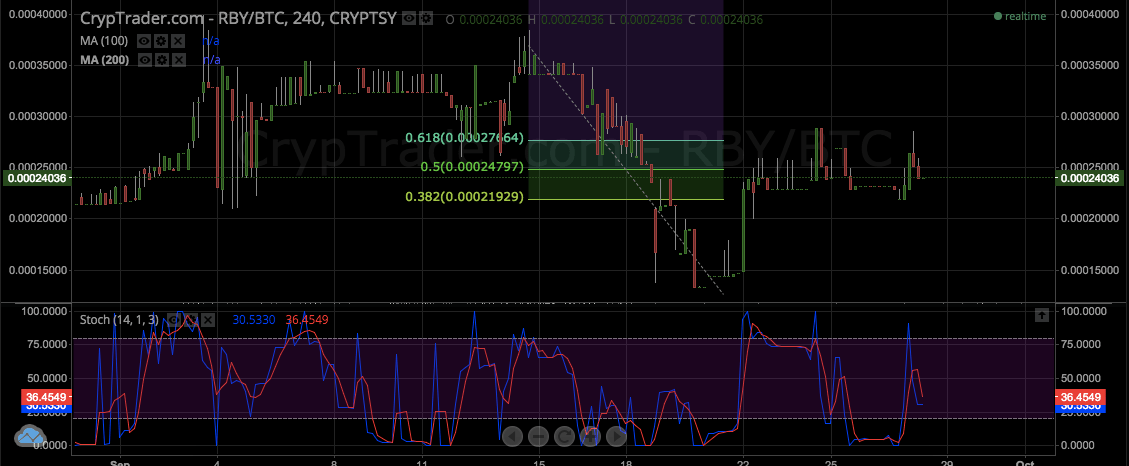
- Rubycoin price is still completing its corrective wave on the 4-hour time frame, as price is stalling around the 61.8% Fibonacci retracement level.
- A short-term double top pattern can be seen right on the resistance, indicating that the impulse wave might be ready to start.
Rubycoin price is gearing up for another sharp drop to its previous lows after making a pullback on its selloff.
Bears Waiting
Stochastic is pointing down, which means that selling momentum is in play, but bears might be holding out for more confirmation. A break below the double top neckline around 0.000240BTC might be enough to spur a surge in bearish pressure.

On the other hand, a break past the previous highs close to the 0.000300BTC level could indicate a strong pickup in bullish momentum, potentially leading to a climb up to the previous highs around 0.000400BTC. A continuation of the downtrend, however, could lead to a drop until the 0.000150BTC area.
A bounce off the current support area might still spur another test of the nearby resistance at 0.000300BTC, creating a triple top formation or starting a range pattern.
Intraday support level – 0.000240BTC
Intraday resistance level – 0.000300BTC
Charts from CrypTrader.com


