

Over the last week, Polkadot shot up by 16% pushing DOT to trade at $21.15 at the time of writing. The bullish momentum helped the coin to trade above the $20 support level. Over the last 24 hours, DOT lost 2% of its market value. The coin was seen oscillating between $22.62 and $21 at press time.
Polkadot had tried to breach the $22.62 resistance mark for quite some time over the past few days. The bulls were rejected each time as the aforementioned price ceiling has acted as a robust one. Although DOT flashed sideways trading, the bulls managed to keep prices above the 20-SMA line in the past few days. At press time, however, it could be seen that the bears were back as prices dipped below the 20-SMA mark.
Price Analysis: DOT/USD Four Hour

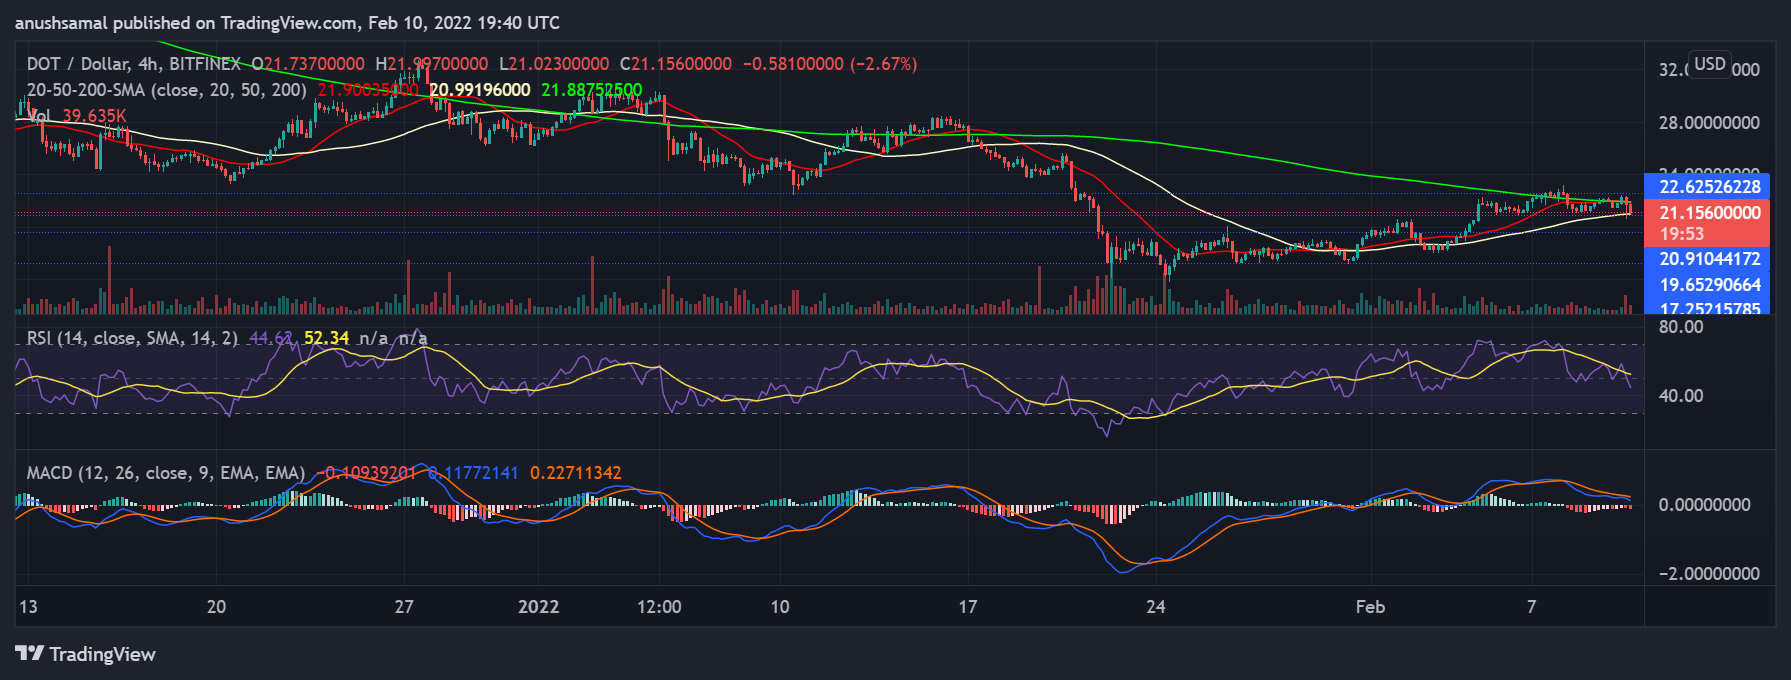
The price of DOT was seen below the 20-SMA line which meant that the price momentum of the coin was dragged by sellers. The nearest support region for DOT stood from $20.91 to $19.65. Polkadot’s trendline has been on the upside in the past few days as the coin continued to secure gains over the mentioned time frame.
Polkadot considerably traded at the $22 price mark for a long, however, its attempt to move above that price level was dampened by the bears. The coin failed to trade above the crucial resistance mark, as a reason, DOT depreciated at press time. Continued sideways trading will further push prices down from the current level.
Technical outlook also picked up on the bearish price action and flashed bearishness at the time of writing. The Relative Strength Index had managed to sustain over the half-line as long as the bulls were near $22, the moment the coin lost momentum RSI fell through the zero-line. A fall beneath the zero-line presented a sell signal and sellers were seen overtaking buyers in the market.
MACD was also negative as the indicator underwent a bearish crossover. Red histograms were seen below the half-line, in accordance with the same reading, RSI depicted an increased number of sellers. MACD had displayed a sell signal for DOT.
Related Reading | Ethereum Beats Out Walmart, Mastercard To Be 25th Largest Asset In The World
Next Trading Levels Of DOT
The continued drag from sellers would push the coin to $20.91 and then to $19.65. The volume of DOT was seen closing in the red in the past two trading sessions. Red volume bars are indicative of bearish price movement, this meant that the majority of exchanges happened through selling.
In the event of bulls re-surfacing, which could happen if prices reclaimed the $22 mark, there could be a positive price break-out. A break on the upside would propel prices to the next price ceiling of $25, however over the trading sessions DOT would keep moving on the downside and then attempt to reach the aforementioned resistance mark if the $22 mark again doesn’t prove to be a stiff price ceiling for the coin.
Related Reading | Cardano (ADA) Price Touches $1.20 Aims To Regain Previous Losses