Hi Everyone,
On Friday the 13th, many people like to tell ghost stories or scary tales in an odd tradition that dates back to Jesus’ last supper. Personally, I don’t much care for such superstition but it could make for some fun antics.
One article circulating lately is this story about “the real US debt”…

As we know, the national debt of the United States has been rising pretty fast lately and is now at approximately $22.5 trillion. This is kind of a big deal because pretty much the entire global economy is sitting on top of US debt and if they were to default on any payments it could directly result in a breakdown of the global economy and with it social order.
Not that that’s a particularly likely scenario though. It’s far too easy to take these sort of headlines way out of context.
Let’s say you’ve got a camel and he’s currently carrying 22.5 bales of straw. Then someone comes along and starts calculating, and they tell you that over the course of the next few decades, that camel is obligated to carry 400 bales. That doesn’t tell us anything about the health of the camel or his max capacity for carrying straw.
See, the future is always in motion. The weight of a bale of straw could vary in the next few years depending on industry standards as can the strength of the US Dollar or the US debt obligations for that matter. Here’s an article from CNBC for example that does a much better job of putting these numbers in the context and is far less spooky.
Yes, the straw that broke the camel’s back is the most famous but the vast majority of camels can be loaded up and unloaded hundreds of times in their careers without ever having their backs broken.
@MatiGreenspan – eToro, Senior Market Analyst
Today’s Highlights
- New Stimulus Package
- What is a Triangle?
- Crypto Greyness
Please note: All data, figures & graphs are valid as of September 13th. All trading carries risk. Only risk capital you can afford to lose.
Traditional Markets
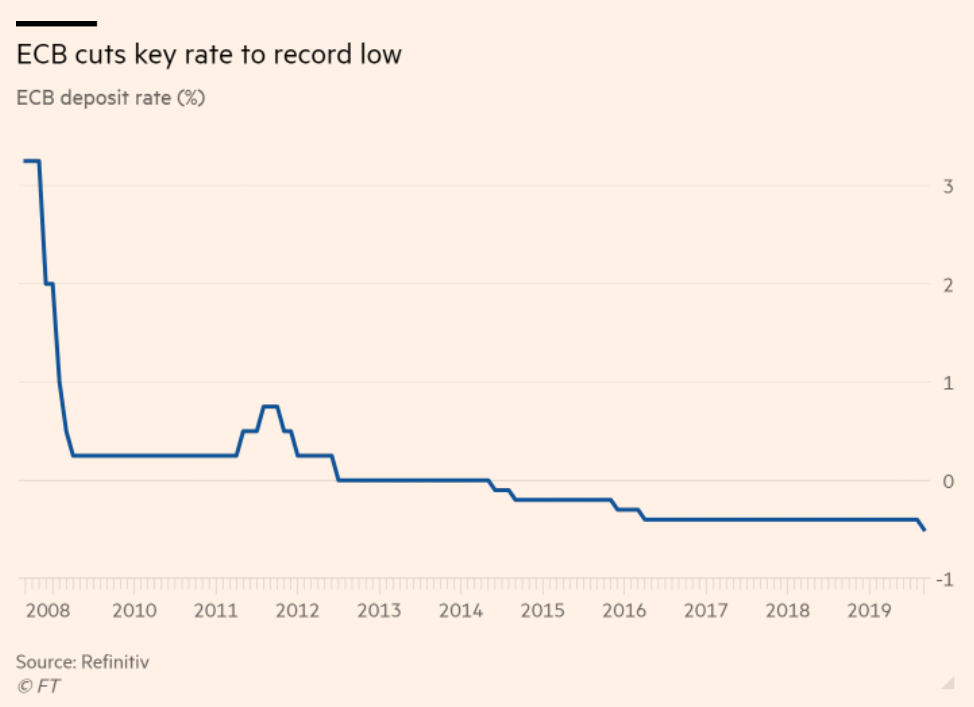
Yesterday’s ECB meeting was expected to be groundbreaking but it seems that Mario Draghi’s legacy is growing bigger by the day. In his second to last interest rate meeting, before his term expires on October 31st, Draghi delivered the biggest stimulus package the ECB has seen in three years in addition to cutting interest rates further into negative territory.
(I’d normally paste a headline here but the headlines simply don’t do it justice this time.)
However, we can definitely post a graph of what Eurozone interest rates are like. Check out that zero line.
The stimulus promised wasn’t a one-off either. The QE spigot has now been officially reopened as the ECB will be buying approximately €20,000 per month for the foreseeable future.
Unsurprisingly, President Trump is furious…
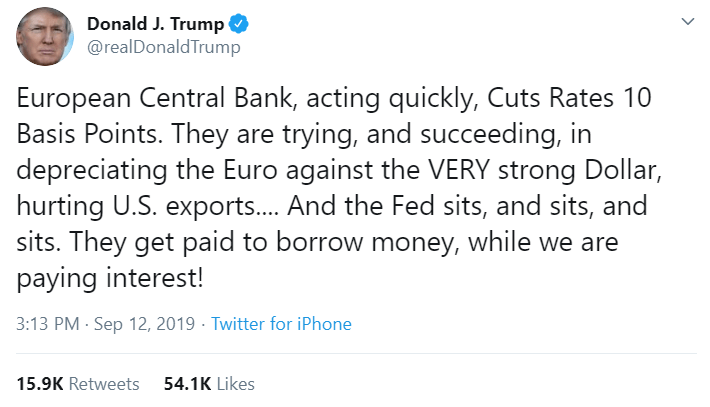
This comes on the back of a tweet he sent on Wednesday that quite shockingly advocated for negative interest rates in the United States.
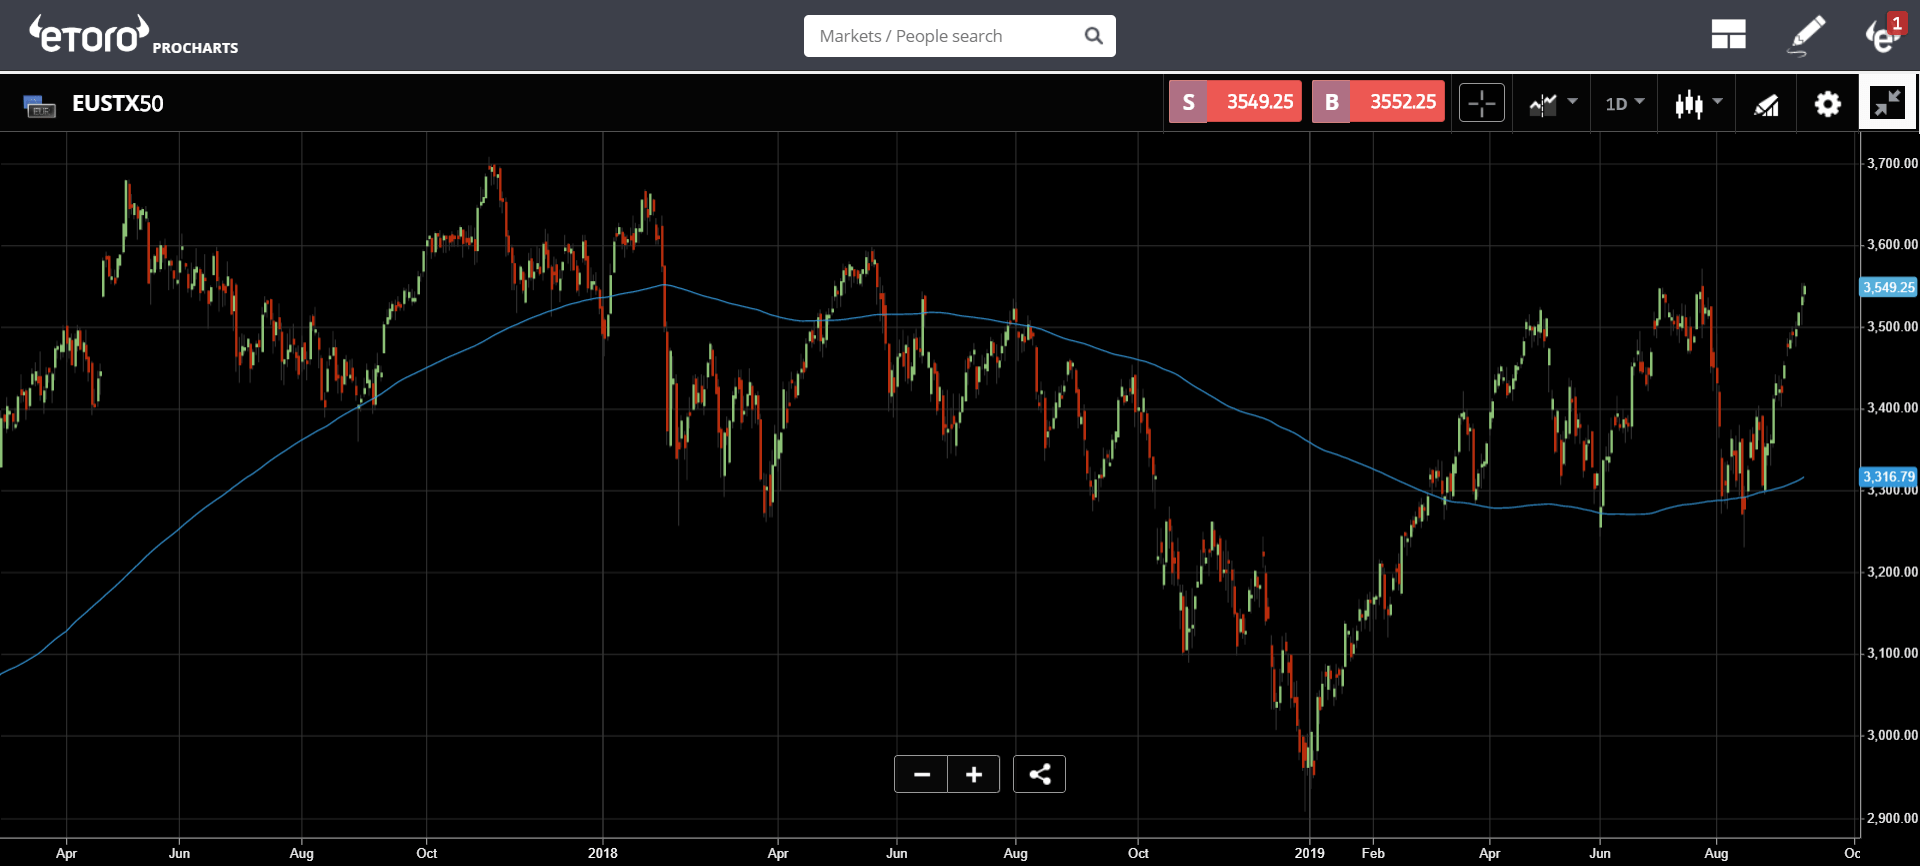
As far as the markets are concerned, they seem quite happy with the additional stimulus. Here we can see the Eurostox 50 index, which is having a nice run over the last few days and is now looking to achieve a new yearly high.
Anti-trigonometry
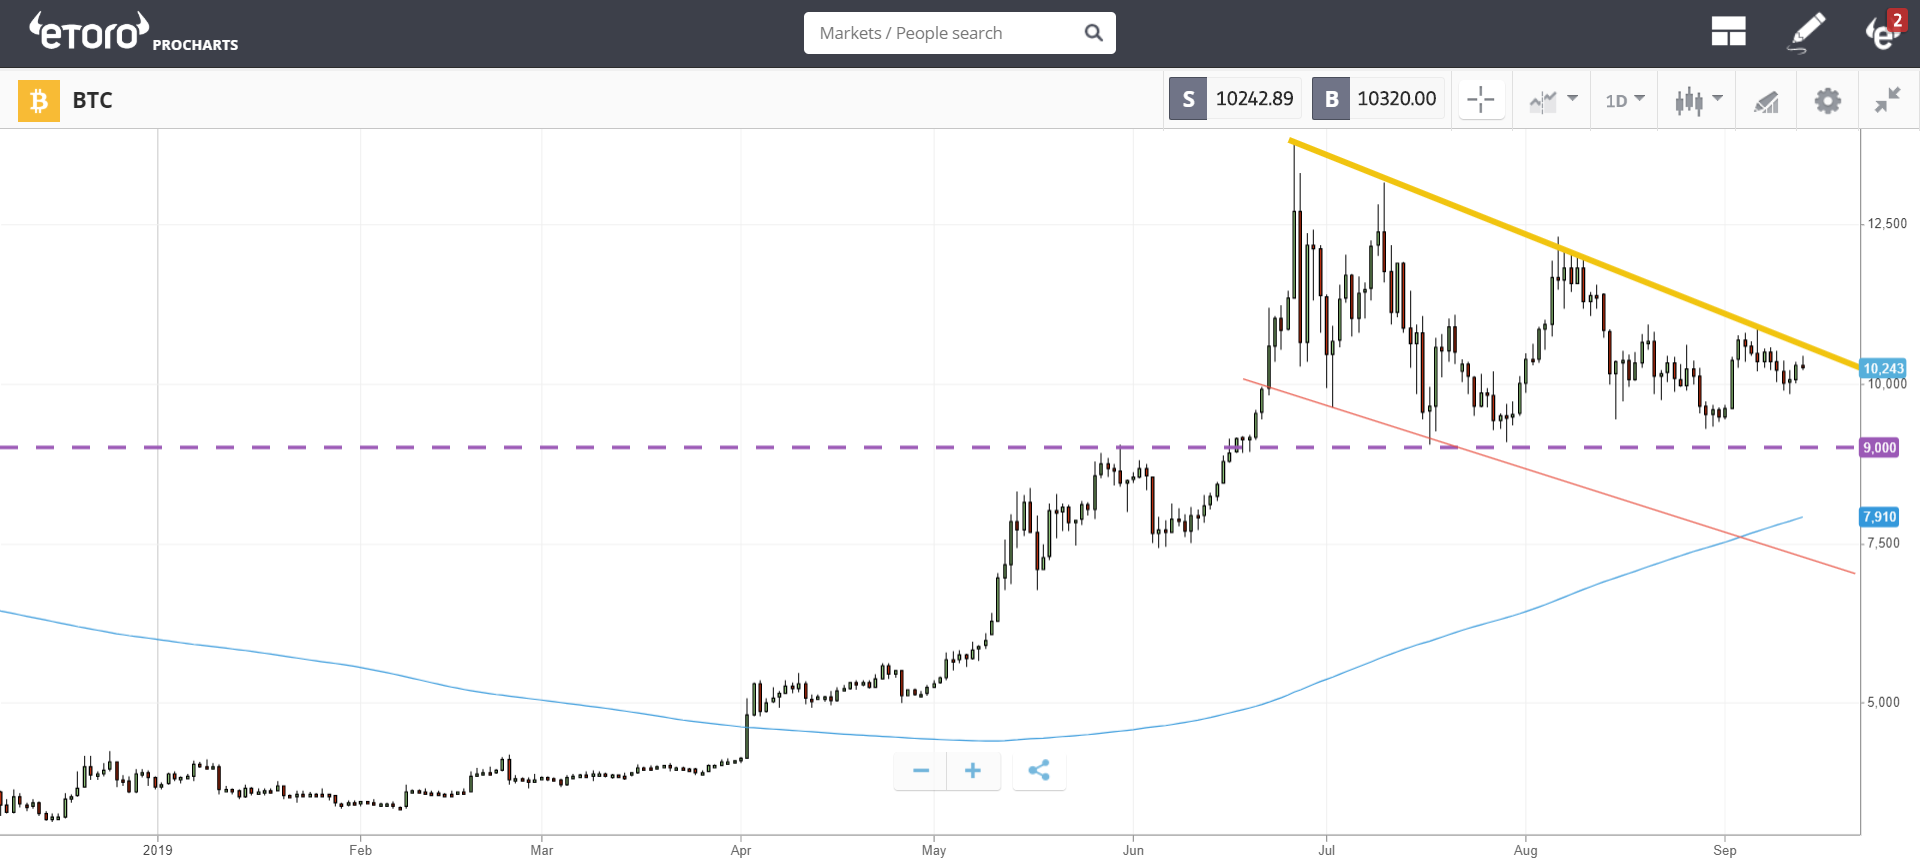
Some of you may recall that in our weekly interview with CoinTelegraph on Monday, I pointed out a familiar pattern on bitcoin’s graph known as the descending triangle. So I was a bit surprised to see this article pop out a few days later.

First off, I’d like to say Scott that I respect your opinion and that the analysis was written quite clearly in a crisp and concise format, so well done. In fact, I’m glad you wrote it as it gives us a great opportunity to explore these principles more closely. That said, I’m gonna have to disagree with your conclusion… big time!
If, as you say, most analysts are spotting this pattern then it’s most likely that this is the correct interpretation. Yes, it can also be seen as a bullish flag but that would seem to ignore that strong psychological support that is being built at $9,000.
Where you’re flat out wrong is that we will never know who is wrong and who is right. We’re simply playing a game of odds and statistics. If a descending triangle breaks to the upside, it doesn’t mean that it wasn’t a descending triangle. Same goes for a bullish flag that breaks down.
Past performance is not an indication of future results.
Perhaps my favorite part was the last two paragraphs where you said that we really need to explore the reason behind the pattern rather than just focusing on the lines. So let’s do that…
A bullish flag pattern is usually the result of a minor retracement in a strong upward trend. The retracement is so minor that bears are simply not able to take it down very far, thus the end result resembles a giant flag pole with a small flag at the top. In this case however, the flag is so big that it’s drooping halfway down the pole. Yes, it’s possible but looks a bit funny.
A descending triangle is the result of sellers needing to settle for an increasingly lower price resulting in lower lows at the top, and a downward sloping resistance and buyers eager to observe a psychological flat barrier on the bottom. In this case, the region above the flat line of $9,000 is being seen as cheap. That’s also why this pattern tends to break to the downside. It’s because when there’s a clash between simple psychology and actual market flows of supply vs demand, the psychological line is much more likely to break.
In any case, we’re really just talking about two sides of the same coin. There really isn’t much room for right and wrong but rather it’s a matter of interpretation. My interpretation is simply better.
Crypto Areas of Grey
We all know that privacy is important. If you’re still not sure why then you should be listening to more Snowden. However, when it comes to currency, if everything is anonymous it opens the door to some really bad stuff. So it’s important to find the balance.
In this interview with Block TV. Our CEO and Co-founder Yoni Assia discusses this balance and how to find it. As well, prodded by the expert Yael Lavie he goes into current market conditions and trends that are critical for today’s Fintech investors. Yoni is always insightful and this interview is definitely worthwhile.
Take a look at this link: https://blocktv.com/watch/2019-09-02/5d6ce0497e146-etoro-founder-yoni-assia-predicts-gradual-bitcoin-rise
Wishing you an amazing weekend ahead.
About the Author: Mati Greenspan is a Senior Market Analyst at eToro

Connect with Mati on….

eToro: http://etoro.tw/Mati
Twitter: https://twitter.com/matigreenspan
LinkedIn: https://www.linkedin.com/in/matisyahu/
Telegram: https://t.me/MatiGreenspan
Office Phone: +44-203-1500308 (ext:311)
Disclaimer: The opinions expressed in this article do not represent the views of NewsBTC
or any of its team members. NewsBTC is neither responsible nor liable for the accuracy of
any of the information supplied in Sponsored Stories/Press Releases such as this one.


