Hi Everyone,
A sudden wave of fear came over the crypto markets last night as bitcoin and all the top cryptos have snapped a long period of apathy with a drastic plunge.
There do seem to be several narratives surrounding this breakdown and we’ll get into all of them below but I just want to take a moment to say… I told you so.
It’s not something I get to say often and there are certainly times when I’ll admit that I’ve been wrong, but ever since I came back from my vacation on September 9th, I’ve been talking about this being the most likely scenario for Bitcoin.
Here’s the video interview with Cointelegraph where I explained the descending triangle setup that was forming at the time, and here you have it in tweet format. In this analysis, we mentioned that in the likely event of a breakout to the downside, the most likely level of support would come at the 200 day moving average, which is getting a good test as we speak.
Those of you who’ve been reading these updates daily shouldn’t be surprised at all by the price action over the last 24 hours.
@MatiGreenspan – eToro, Senior Market Analyst
Today’s Highlights
- Impeachment
- The #HashCrash
- Where do we go from here?
Please note: All data, figures & graphs are valid as of September 25th. All trading carries risk. Only risk capital you can afford to lose.
Traditional Markets
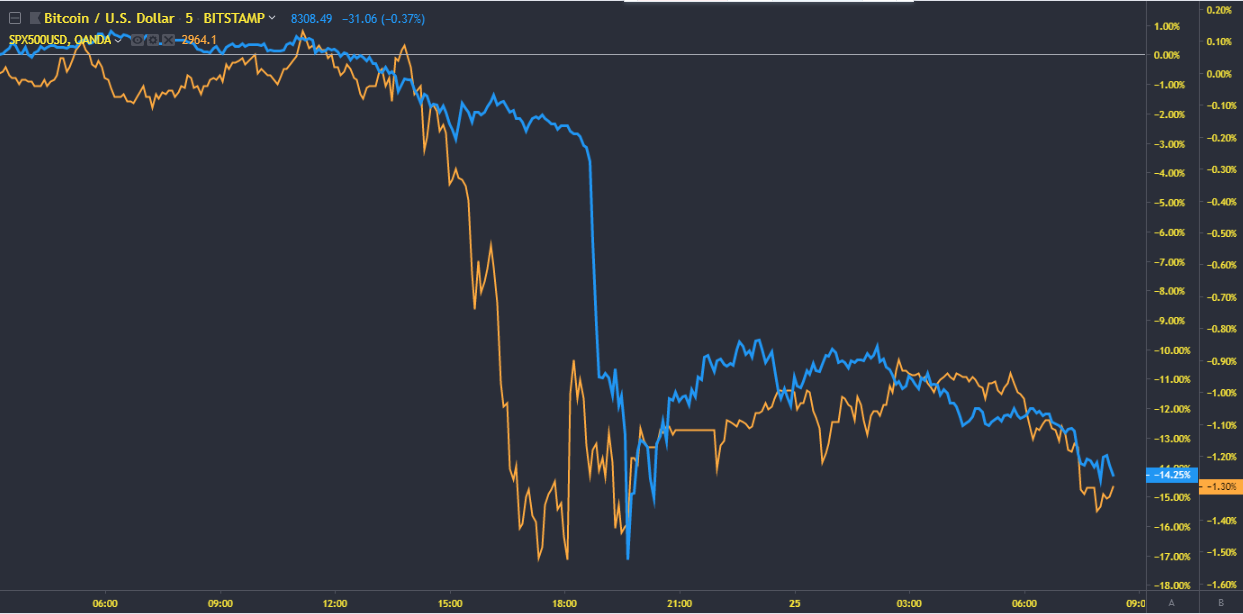
Even though Crypto is often touted as an uncorrelated asset class, there’s no denying the strong coincidence that the US stock market took a hit just a short time before bitcoin did.
Here we can see yesterday’s action in the stock market (orange line) who’s plunge directly preceded that of bitcoin (blue).

(chart created on tradingview.com. Notice that we use two Y-axis as the percentage drops are vastly different.)
The stock market of course was reacting to the news that…

Really?! Out of all the things President Trump has done, this obscure conversation he had with the Ukrainian President. Alright. Whatever.
In any case, impeachment proceedings could possibly be drawn out for months and it seems to have caused some investors to reassess the chances of a 2020 victory and to wonder how this might influence US-China trade talks.
The bitcoin connection is a rather obscure one, but some followers have suggested to me that people who trade both stocks and crypto may have liquidated bitcoin positions in order to fund margin calls in the stocks. Sounds pretty far-fetched to me, but it is a theory.
The Great #HashCrash
In my mind, the main catalyst for last nights crypto crash was due to the underwhelming Bakkt launch. People have been buying the rumor with high hopes for months and many have now sold the disappointing news. We dove into this in yesterday’s email so I’m not going to bore you by repeating it. Do feel free to review if you haven’t read it yet.
Another theory though is attributing a sudden drop in bitcoin’s hashrate. Now, this gets pretty technical so bear with me.
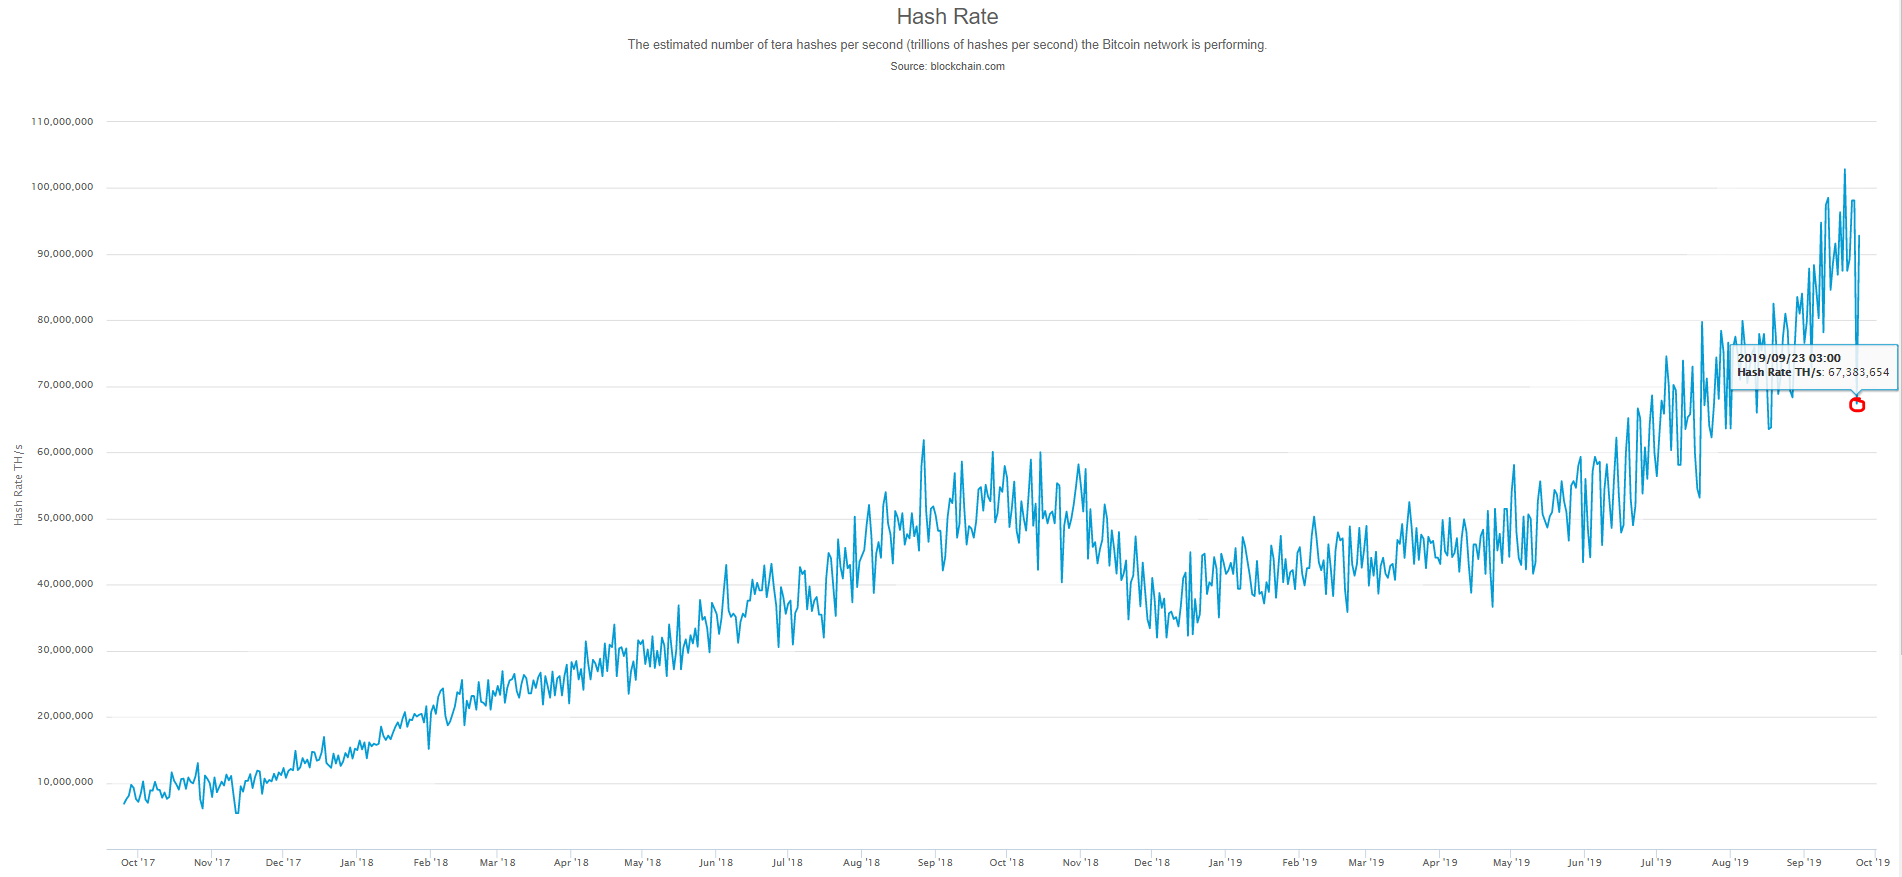
Bitcoin network watchers have been speaking for weeks now about a rapid rise in the total amount of computing power (hashrate) that is currently being deployed by miners to secure the network. On September 18th it reached an all-time high of nearly 103 quintillion hashes per second, which apparently is a lot.

On Monday, as is seen in the chart above from blockchain.info, a very sudden and inexplicable drop was reported, leading to a few ridiculous headlines like this:

Speculation was running free about what may have caused the sudden plunge in hashrate. Some said it was due to a crackdown in China, while some pointed to power outages in Canada and Kyrgyzstan.
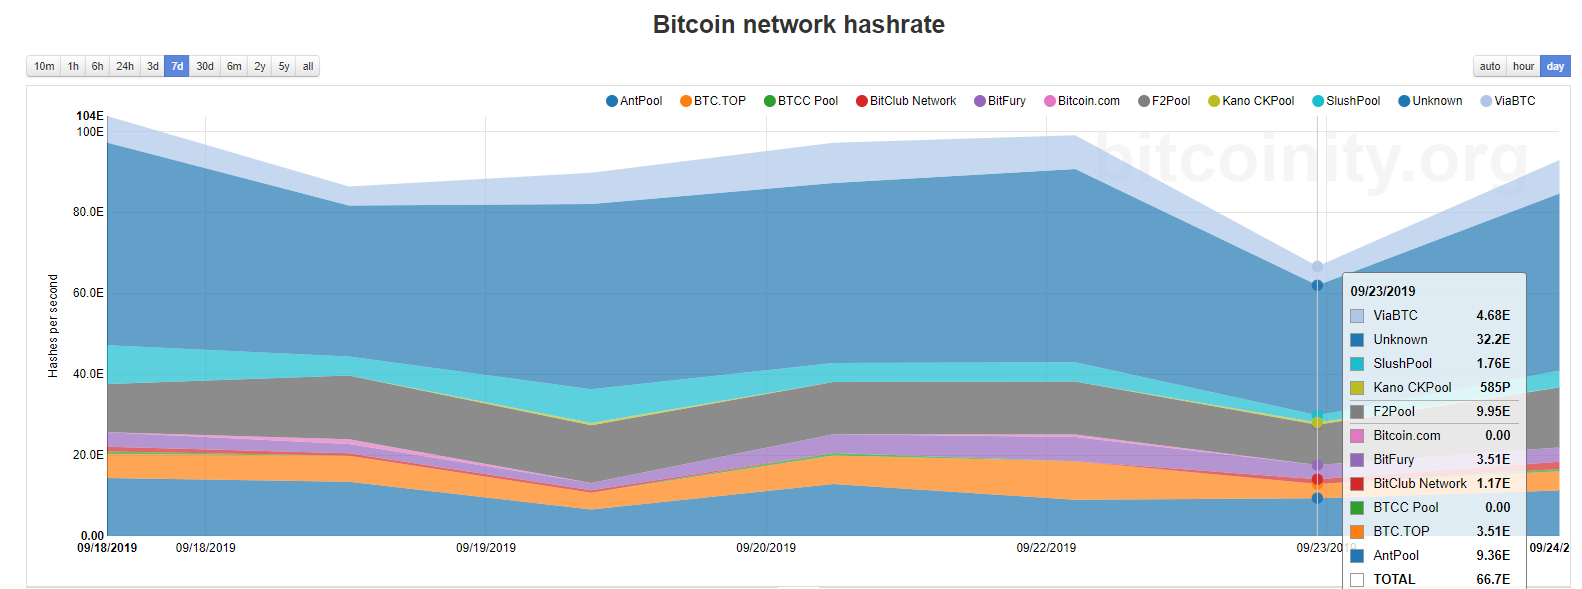
What’s interesting to note is that this could not have been caused by any single mining pool going offline. As we can see in this graph, the reduction in hash was spread fairly evenly between the various pools.

Others theorize that the drop in hashrate was largely over-exaggerated. I want to thank James Prestwich, the CEO of Summa, for a detailed explanation this morning of how hashrates are calculated. I’ll spare you the details but the short of it is that it’s impossible to know exactly how much hash there is at any given moment and the best we can do is estimate the amounts at any given period.
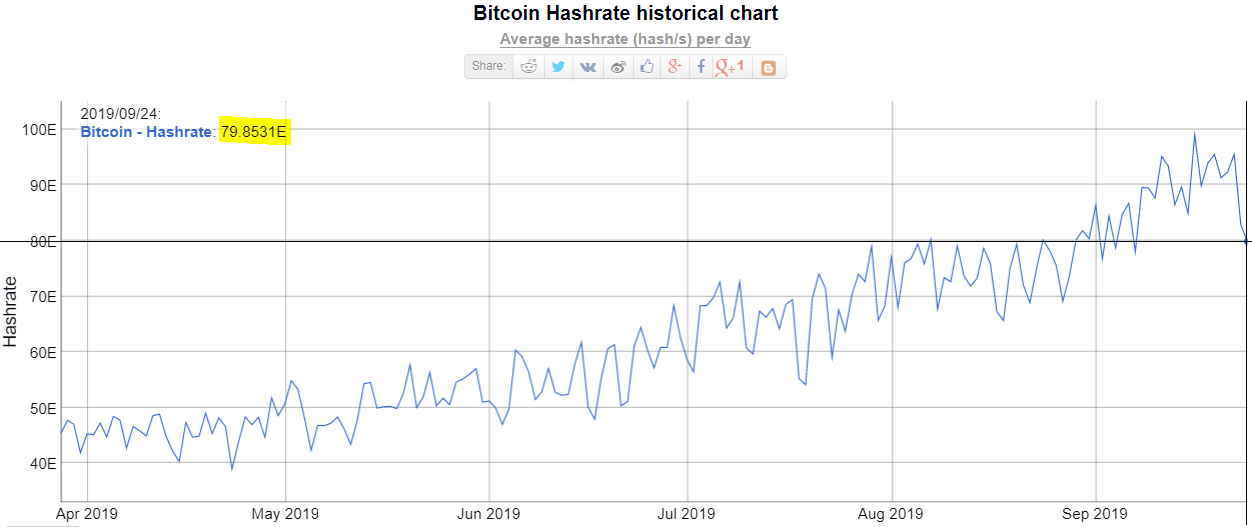
Evidence of this can be found by looking at other sites. For example, on bitinfocharts.com, we can see that the hash crash was not nearly as drastic.

In any case, blockchain.info is already reporting a complete recovery of the hashrate back to the level it was at before the mysterious drop. Still, it’d be nice to know what caused it in the first place, even if the swings weren’t as dramatic as some made it seem.
Where do we go from here?
I don’t know.
According to the technical setup outlined above, now we test the 200 day moving average. We’ll need to keep a close eye to see if we get a strong bounce, a further breakdown, or even just keep testing it for a while.
Let’s have an awesome day!!
About the Author: Mati Greenspan is a Senior Market Analyst at eToro

Connect with Mati on….

eToro: http://etoro.tw/Mati
Twitter: https://twitter.com/matigreenspan
LinkedIn: https://www.linkedin.com/in/matisyahu/
Telegram: https://t.me/MatiGreenspan
Office Phone: +44-203-1500308 (ext:311)
Disclaimer: The opinions expressed in this article do not represent the views of NewsBTC
or any of its team members. NewsBTC is neither responsible nor liable for the accuracy of
any of the information supplied in Sponsored Stories/Press Releases such as this one.


