
Reason to trust
How Our News is Made
Strict editorial policy that focuses on accuracy, relevance, and impartiality
Ad discliamer
Morbi pretium leo et nisl aliquam mollis. Quisque arcu lorem, ultricies quis pellentesque nec, ullamcorper eu odio.
Bitcoin opened 2020 with a bang, rising by as much as 32 percent in January as investors’ appetite for safe-haven assets grew. However, the price rally is now looking to fizzle.
The bitcoin-to-dollar exchange rate has dipped by circa 9 percent after registering a local top near $9,200. The pair on Friday tested $8,216 as intraday support, hinting risks of an extended downside move that could push the price into a medium-term bearish channel.
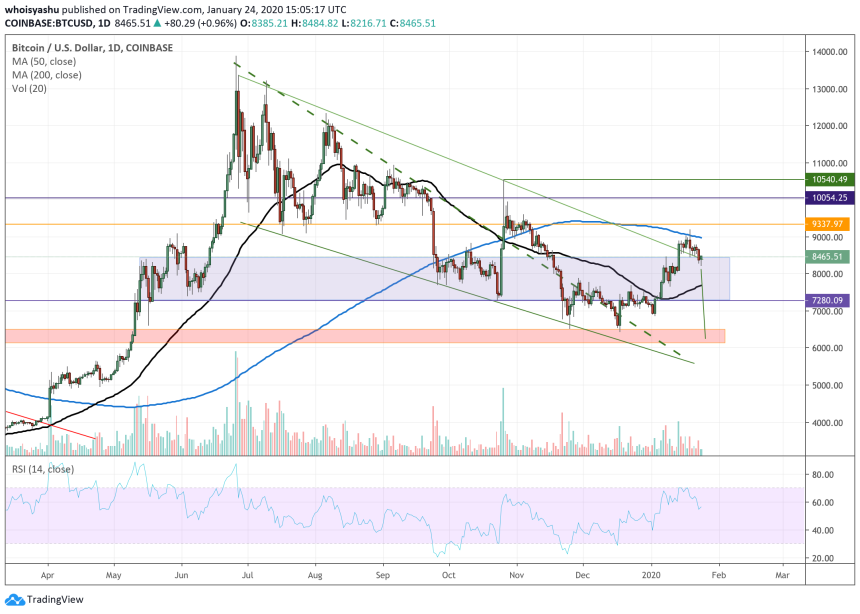
The Descending Channel, as shown in the chart below, could gravitate bitcoin towards the redded support area having a baseline near $6,000.
But
A top market analyst believes bitcoin is less likely to hit the $6,000 level.
YouTuber Sunny Decree explained in one of his latest reports that the cryptocurrency, at best, would fall in the range defined by $7,239 and $7,957. From there, it could rebound towards its prevalent resistance levels, mainly the blacked 200-daily moving average wave in the chart above.
Mr. Decree cited the range after testing it against Volume Profile Visible Range (VPVR) – an indicator that finds support/resistance levels based on the trading activity around them over a specific period of time. The analyst noted higher volumes near the $7,957-support, showing traders became highly active around the level.
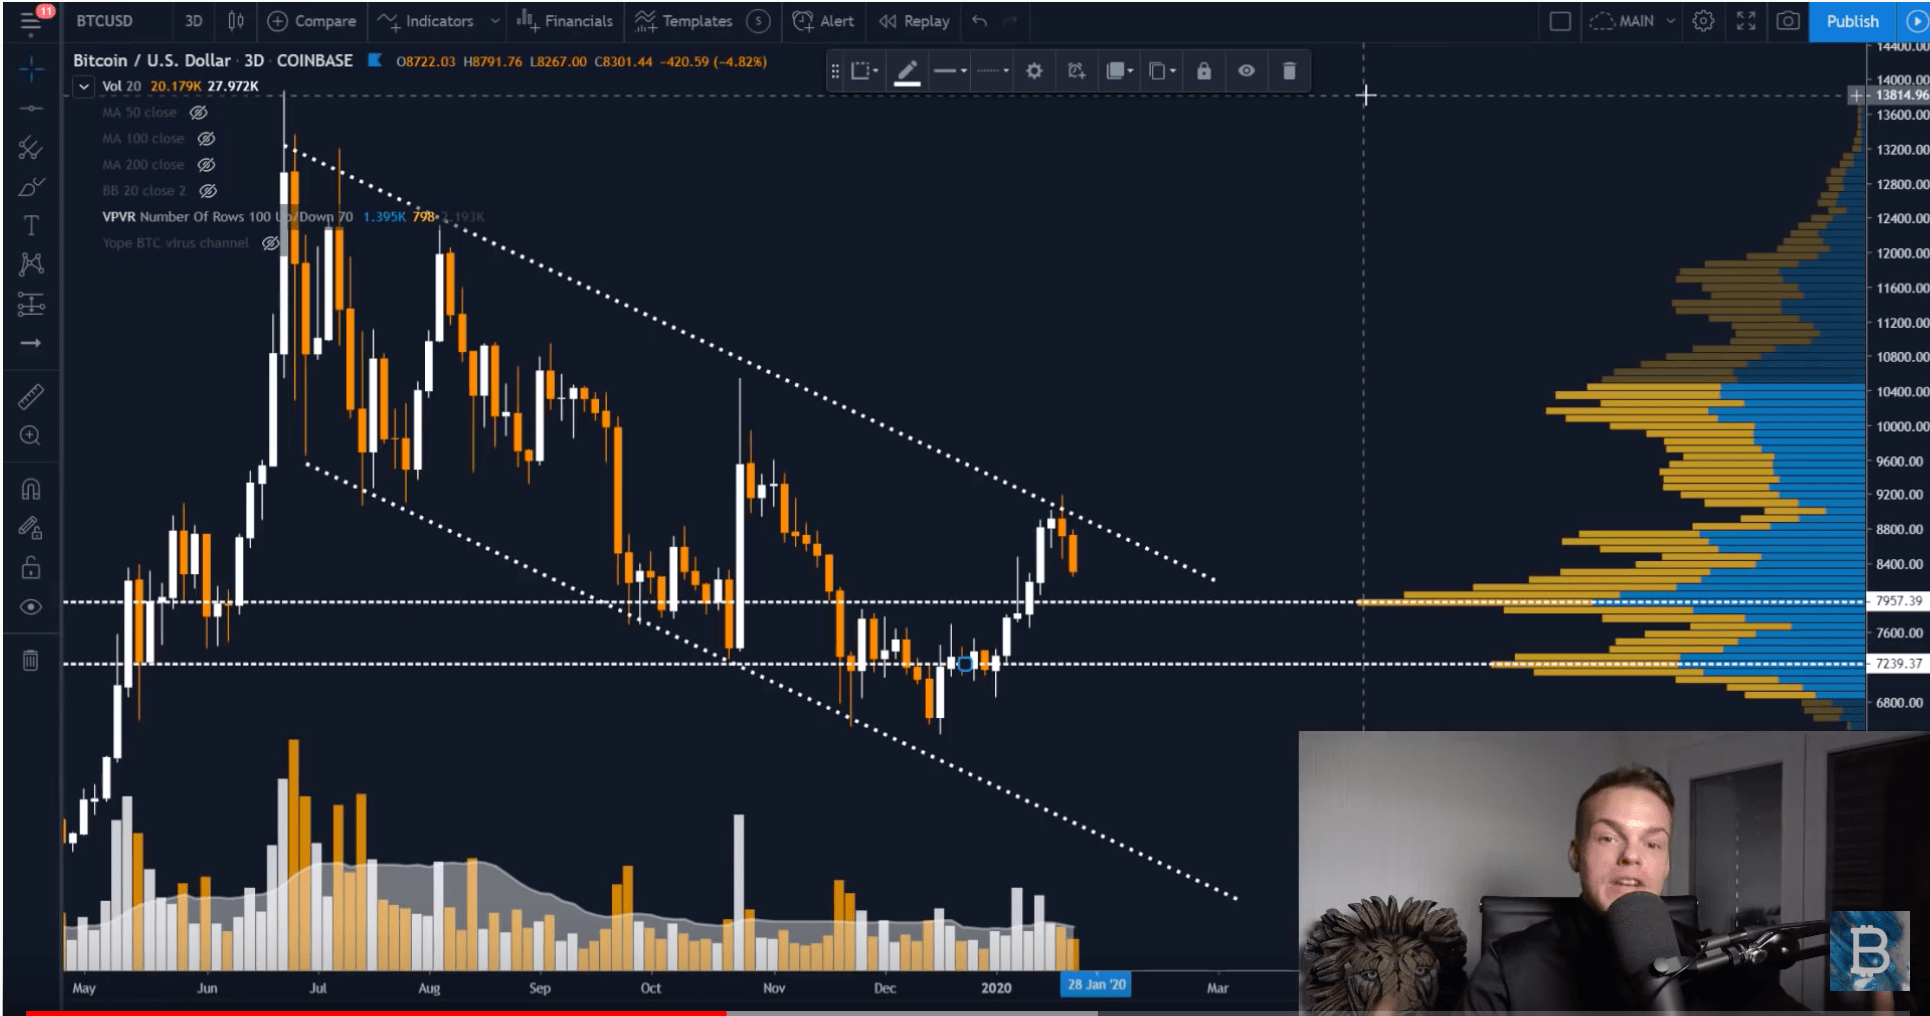
Similarly, the $7,239-support showed slightly lesser but yet higher trade activity, allowing Mr. Decree to rule the area between it and $7,957 a potential pullback range.
“I would personally, strongly that bitcoin is going to bounce somewhere between the [said levels] to the upside,” he said, adding that it could push the price towards $10,500.
The prediction left a lot of burden on VPVR to prove itself as a reliable tool. A quick search across TradingView.com showed that many leading traders have used the proprietary indicator to predict support/resistance based on high and low volumes zones/nodes.
Further Fall for Bitcoin?
Fractal analysts have a different say when it comes to predicting the next bounce back. They have long analyzed the cryptocurrency’s price behavior based on its historical performances. Renowned trader Haejin, for instance, sees a lot of similarity between bitcoin’s current downside actions and the ones noted during the 2018’s crypto winter.
https://t.co/JhMTlE2zA1: Bitcoin Deja vu?
Here is a Members only chart: Note the Inverse H&S on both fractals.
Also the three wave ABC price constructs
The downward price channel
The upward wedge
Declining volumes
Potential Capitulation VolumeAll within 4 months? Hmmm. pic.twitter.com/hXNN53PI7B
— Haejin (@Haejin_Crypto) January 17, 2020
The analyst thinks bitcoin would not only fall towards $6,000 but would extend its plunge to as low as $3,300.
Bulls, on the other hand, have ‘Halving‘ as a contradictory historical indicator to refute Haeijin’s bearish prediction. They believe the supply shock alone could send bitcoin back to its glorious all-time high of $20,000.


