

Bitcoin Price Key Highlights
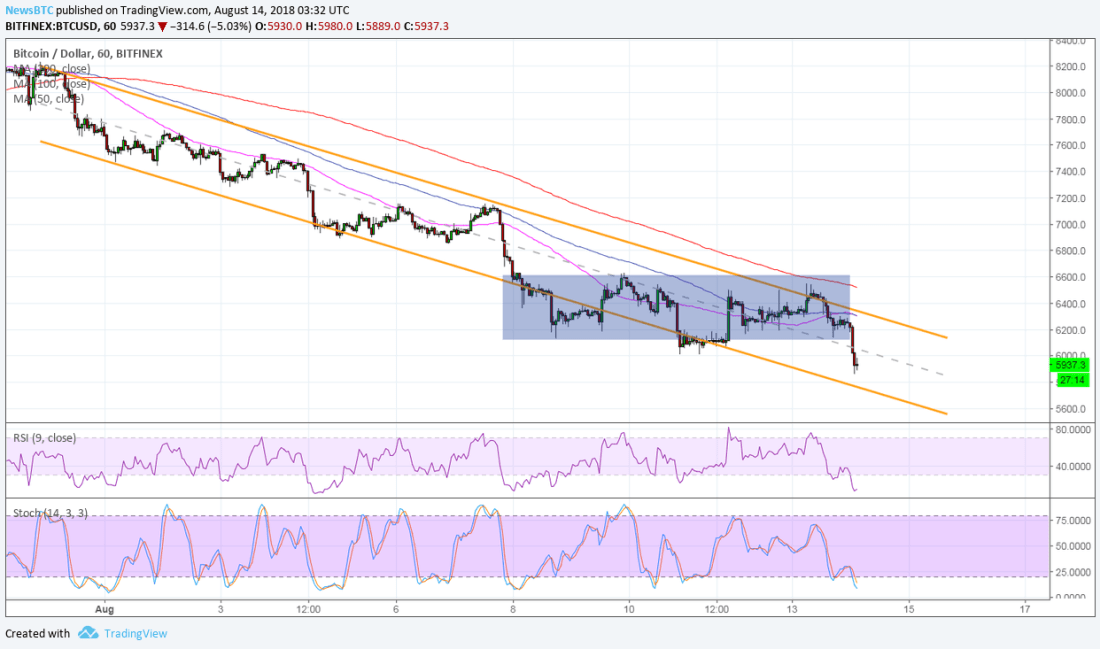
- Bitcoin price has broken below a short-term consolidation pattern and is setting its sights on the next floor.
- Price is still trading inside its descending channel and might be due to test the bottom around $5,600 soon.
- Technical indicators continue to reflect the presence of selling pressure but there are also signs of a possible bounce.
Bitcoin price broke below a short-term consolidation pattern as it gains bearish traction and aims for the next support.
Technical Indicators Signals
The 100 SMA is below the longer-term 200 SMA to indicate that the path of least resistance is to the downside. In other words, the downtrend is still more likely to carry on than to reverse. The 100 SMA lines up with the channel top as well, adding to its strength as a ceiling.
RSI is on the move down to show that selling pressure is present, but the oscillator is already dipping into oversold territory to signal bearish exhaustion. Stochastic is also heading lower but also hitting oversold levels. A bounce could take bitcoin price back up to the channel top at $6,200 while a continuation of selling pressure could even lead to a break below support and a steeper slide.

Market Factors
Cryptocurrencies have already been on rough seas last week as the SEC decision weighed on bitcoin and its peers. This time, the cryptocurrency is actually drawing some demand from the crisis in Turkey as fears of contagion are driving traders away from fiat currencies and European stocks.
However, dollar demand remains supported on these safe-haven flows, possibly the main reason why BTCUSD is still in selloff mode. Bitcoin has jumped to a 7-month high against the Turkish lira, though, and could also be poised to rake in some gains versus European currencies if these risks remain.