So the middle of the week is here already. Things are moving fast in the bitcoin price, and we are pretty much at the mid point of September. Extending that, we’ve only got fifteen days left of the third quarter! Where’s 2016 going…
Oh well. We’ve got plenty of time to reflect on the year as a whole over the coming months – it’s something we’ll probably save until the closing couple of weeks. Right now, we’re well entrenched in our intraday patterns, and we’ve had a pretty successful week so far. Quick in outs, scalp entries and profits, and some pretty tight risk management parameters, have ensured we remain on top of the bitcoin price market throughout the sessions, and we sit net up on the markets as things stand.
We’re looking to get over the Wednesday hump in much the same fashion, and give ourselves something easy heading into the close of the week. Easier said than done, of course, but that’s the nature of the game.
So, as we head into the session today, let’s get a look at what’s going on. As ever, take a quick look at the chart below to get an idea of the key levels. It’s our standard five-minute candlestick chart showing overnight action, and has our range overlaid in green.
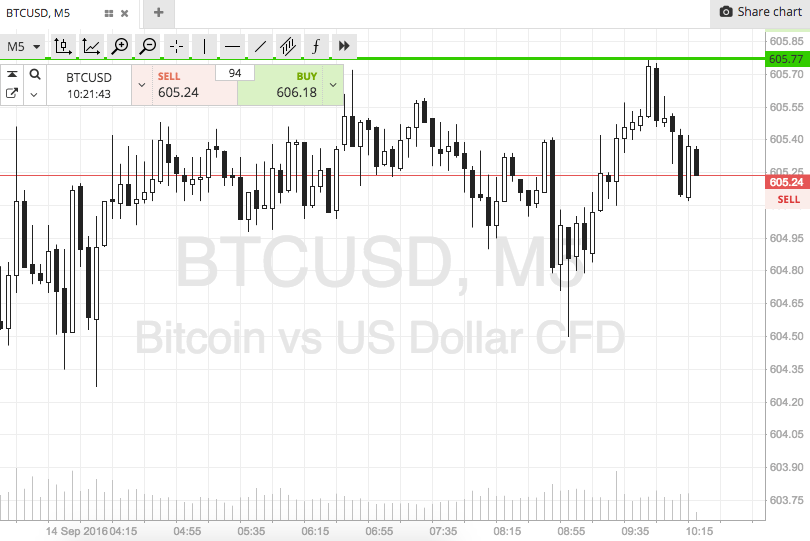

As the chart shows, the range in focus for today’s session is defined by in term support to the downside at 600 and in term resistance to the upside at 605. This is a pretty tight range, so we will be looking at breakout only.
Specifically, if price breaks above in term support, we will look to get in long towards an upside target of 610.
Conversely, if price breaks support, we’ll get in short towards an immediate downside target of 595. A stop on each just the other side of the entry defines risk nicely.
Happy Trading!
Charts courtesy of SimpleFX