Okay, then. Let’s get back to it. Action overnight in the bitcoin price served up plenty of volatility, and we had a pretty good time riding in and out of the markets according to the rules of our predefined strategy yesterday evening. With the action overnight having completed, we now have a fresh range to go at, and with any luck, we can continue to take advantage of the solidity of the levels in question.
So, with this in mind, and as we head into a fresh European session this morning, let’s take a look at the levels in focus and try and put together a strategy with which we can move forward in our operations.
First, as ever, take a look at the chart below to get an idea of which levels are focusing on. It is a 15-minute candlestick chart, and it has around four hours’ worth of action in the price displayed. Our range in focus is overlaid in green.
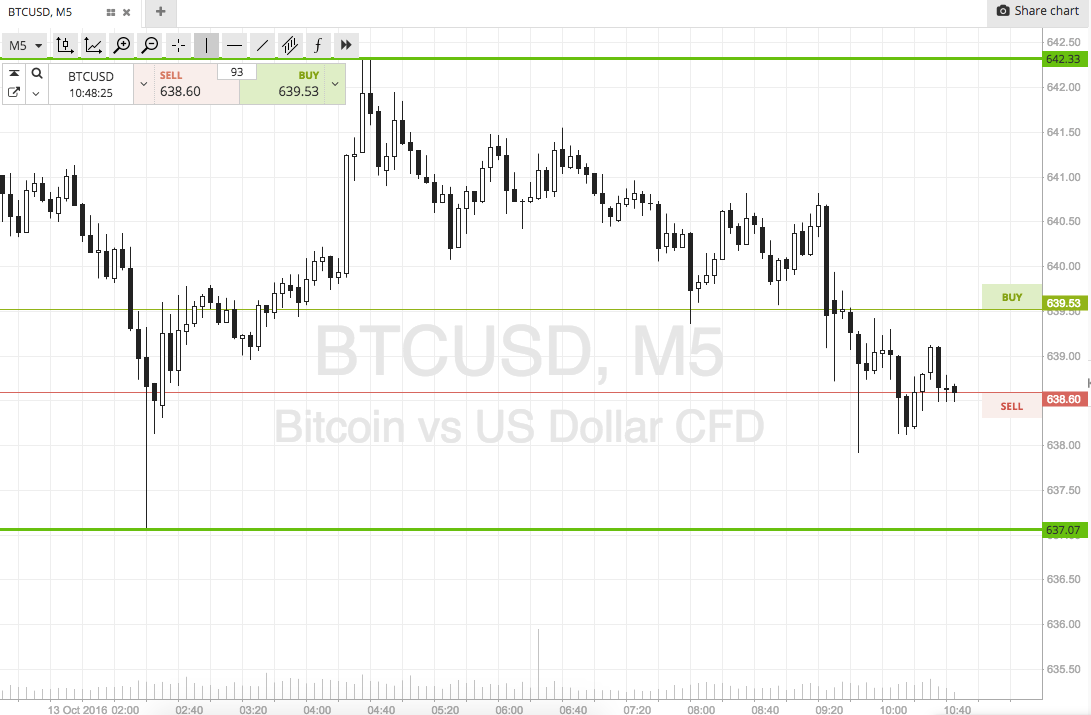

As the chart shows, the range we are looking at for today’s European morning session is defined by 637 to the downside for support and 642 to the upside as resistance. We don’t have enough room to go at price intrarange today, so we will be focusing purely on our breakout strategy for the time being. Specifically, the if we see price break above resistance, we are going to look for a close above this level to validate an immediate upside entry towards a target of 650. A stop loss on this one somewhere in the region of 640 looks good.
Conversely, if price breaks below support, a close below will give us a reason to enter a short position towards an immediate downside target of 630. Again we need a stop loss, and somewhere in the region of 640 looks good
Let’s see how things play out…
Happy Trading!
Charts courtesy of SimpleFX