

Bitcoin price inched further up earlier today to record a high of around $383. Although bitcoin price managed to break the resistance point at 00:00, which corresponded to the line of intersection between the 1 x 1 Gann angle and the 0 Fibonacci retracement level (refer to yesterday’s analysis), it dropped below the 1 x 1 Gann angle a few hours after shooting above this key resistance level.
Bitcoin Price Moving Parallel To the 1 x 1 Gann Angle:
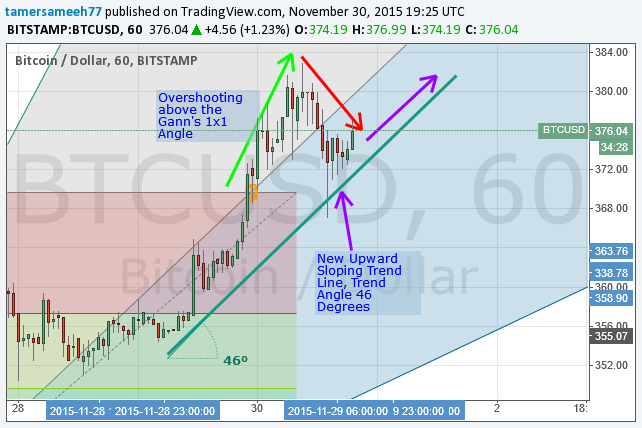
By examining the 1 hour (BTC/USD) charts from Bitstamp and keeping the fibonacci retracements and the Gann angles we plotted during earlier analyses (look at the below chart), we can conclude the following:
- Bitcoin price rose to breach the resistance that corresponded to the point of convergence between the 1 x 1 Gann angle and the 0 Fib retracement level at 00:00 earlier today. However, the bulls weren’t able to keep bitcoin price above the 1 x 1 Gann angle and a few hours later, it dropped below this crucial level of resistance.
- We can now spot a new uptrend line forming, with a trend angle of 46 degrees (calculated by integration of the equation that corresponds to the blue trend line on the below chart). Accordingly, we expect bitcoin price to continue following this new “slope” of rise, which is rather slow and frustrating for the market’s bulls.
- The candlesticks following the 00:00 time bar exhibited long upwards shadows, which represents the instability of bitcoin price above the 1 x 1 Gann angle level.

RSI and Stochastic Oscillator Favoring The Bulls!!
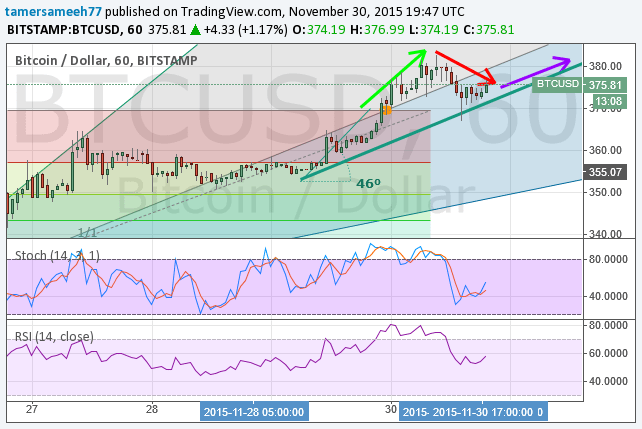
Let’s take a look at the same 1 hour (BTC/USD) charts but after executing the stochastic oscillator and RSI indicator (look at the below chart). We can notice the following:
- The stochastic oscillator values around 50 which represents that bitcoin is not overbought at the current price. Accordingly, we can see bitcoin price test the $382 resistance level within the next couple of days.
- The RSI value 57 which is also in favor of the bulls, as it illustrates the relatively big buying volume of the market presently and we can see the buying volume rise even more, to push the price to higher levels soon.

Conclusion:
Bitcoin price scored a high of $383 earlier today. The price is now following an upward sloping trend line is it travelling below the 1 x 1 Gann angle. Our technical analysis is in favor of continuation of this steady uptrend so that we can see the $382 resistance level tested within the next couple of days.
Charts from Bitstamp, hosted on Tradingview.com