

Bitcoin Price Key Highlights
- Bitcoin price is stuck in consolidation once more, moving inside an ascending triangle pattern visible on its 1-hour time frame.
- Price previously broke below an earlier triangle pattern, hinting that another downside break might be in the cards.
Bitcoin price is currently testing the ascending triangle resistance, still deciding which direction to take, with technical indicators giving mixed signals.
Buyers Still in Control
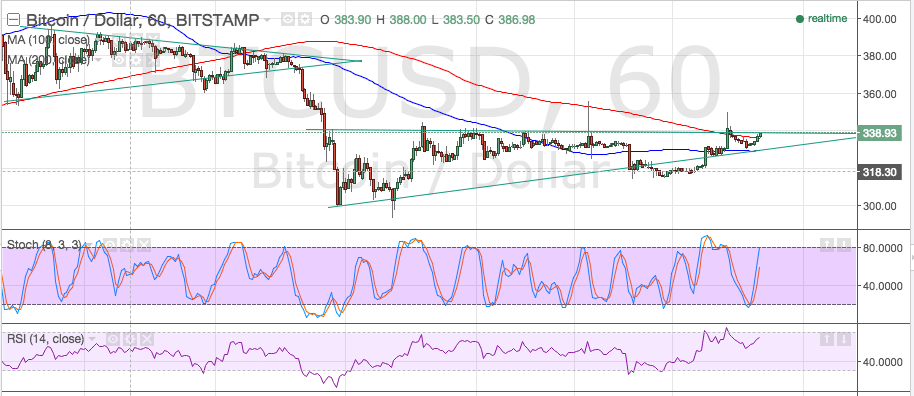
Stochastic is heading north so bitcoin price could still follow suit, potentially spurring an upside break from the triangle resistance around $340 and leading to a climb to the next visible ceiling at $380-400. RSI is also pointing up, indicating that buyers are on top of their game and ready to push for more gains.
Meanwhile, the 100 SMA is below the longer-term 200 SMA, indicating that the longer-term selloff is likely to carry on. This could lead to a downside break of support around $330, possibly pushing bitcoin price to the triangle lows of $300.
Bitcoin price has been consolidating tightly and tightly, approaching the peak of the triangle. This suggests that a breakout in either direction is imminent, with candlestick patterns serving as confirmation signals for momentum.

Once the oscillators hit the overbought areas, sellers could take the upper hand and allow the longer-term trend to resume. At the moment, the 200 SMA is holding as a dynamic resistance level and keeping short-term gains in check.
Keep in mind that the previous triangle breakout led to a drop of around $80 so another breakdown might last by the same amount. The moving averages are inching closer together, though, so an upward crossover and reversal might still be possible. A long green candle closing above the 200 SMA might be an early signal of an uptrend but it might be best to wait for confirmation from the moving averages.
Intraday support level – $330
Intraday resistance level – $340
Technical Indicators Settings:
- 100 SMA and 200 SMA
- Stochastic (8, 3, 3)
- RSI (14)
Charts from BitStamp, courtesy of TradingView