Bitcoin Price Key Highlights
- Bitcoin price finally made a break out of its tight consolidation pattern highlighted in the previous article.
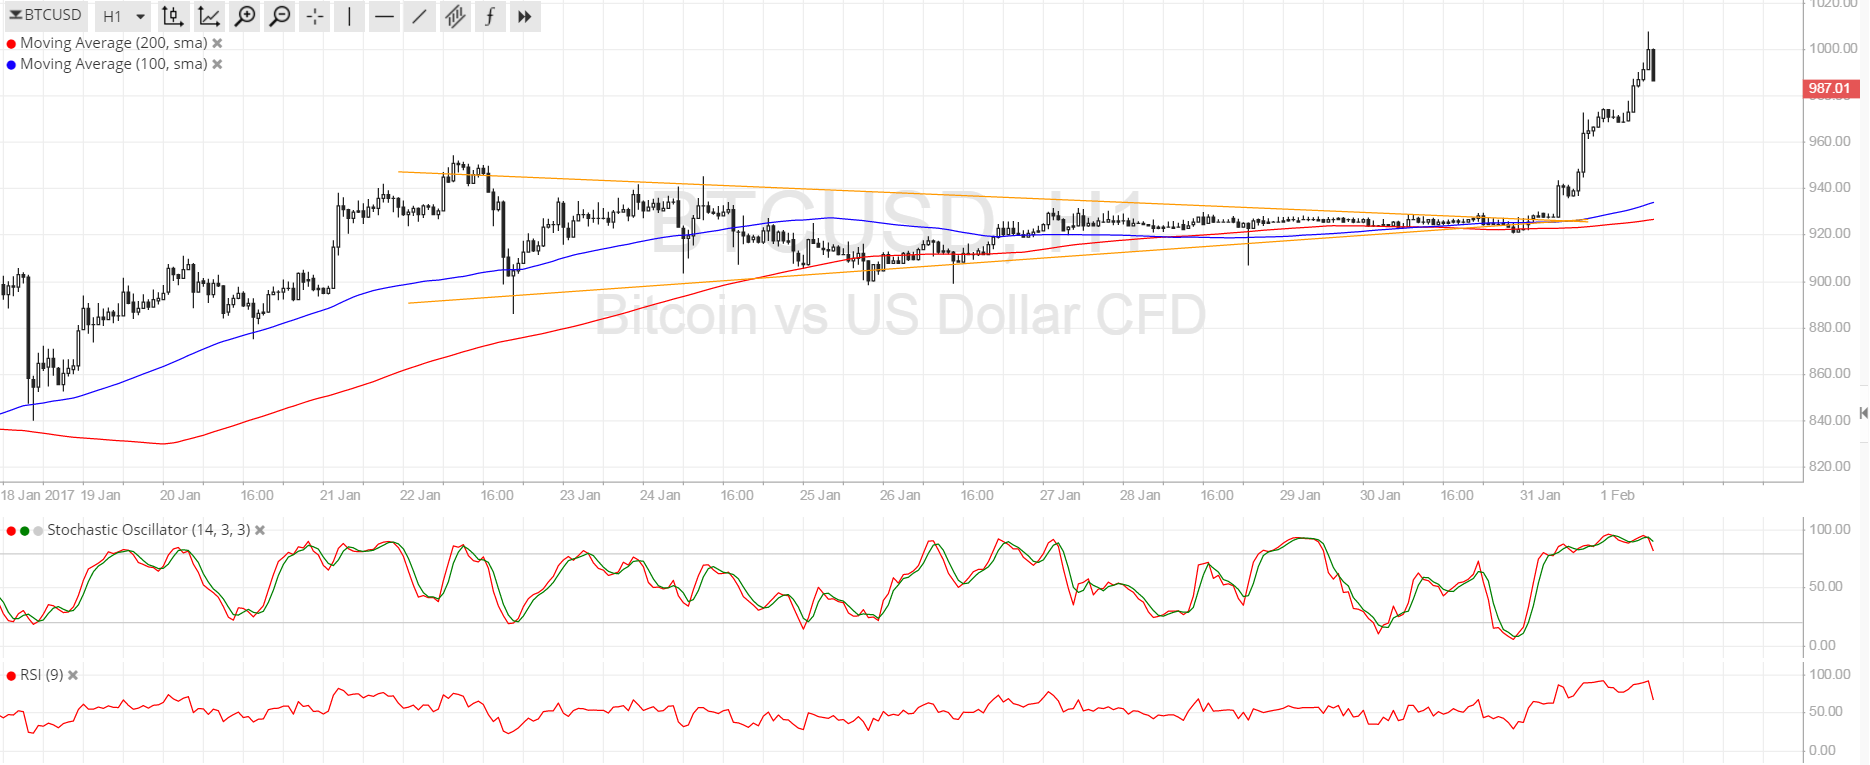
- Price made an upside break and went all the way up to the next ceiling at $1000 as expected.
- Weakness in US markets is starting to take effect on bitcoin price as talks of currency devaluation swirled.
Bitcoin price zoomed up to the $1000 area after breaking above consolidation, signaling a return in bullish momentum.
Technical Indicators Signals
The 100 SMA is still above the 200 SMA on the 1-hour time frame, narrowly avoiding a downward crossover. This signals that the path of least resistance is still to the upside as the gap between the moving averages is widening again. A pullback from the climb could take place soon and these moving averages could serve as dynamic support.
However, both RSI and stochastic are indicating overbought conditions and are turning lower so profit-taking could be possible. In that case, bitcoin price could retreat to nearby support zones at $950 and $900 before resuming its climb. It could also make a retest of the broken resistance at the $920 area of interest.

Market Events
It appears that the rally was mostly driven by US dollar weakness, particularly after President Donald Trump called out Japan and China for currency devaluation. He blamed these nations for taking jobs and companies away from the US due to weak currency tactics, leading some to think that the President is also attempting to jawbone the local currency to gain businesses back.
In any case, this spurred a massive selloff for the dollar across the board, which was also aided by downbeat US economic data. Traders are also likely booking profits ahead of the FOMC statement in today’s New York session as we’ll get a glimpse of how Trump’s actions have influenced the Fed’s monetary policy bias and rate hike time line.
In China, the official manufacturing PMI showed a dip from 51.4 to 51.3 while the non-manufacturing PMI improved from 54.5 to 54.6. Investigations by regulatory agencies on exchanges are still going on but the focus seems to have shifted to US developments for now.
Charts from SimpleFX