Bitcoin Price Key Highlights
- Bitcoin price recently broke above a short-term consolidation pattern, possibly signaling its intention to head further north.
- However, price pulled back to the broken resistance just as quickly so the breakout may have been a result of a squeeze rather than a directional catalyst.
- Scrolling further back reveals that bitcoin price could be ranging between $960 to $1000.
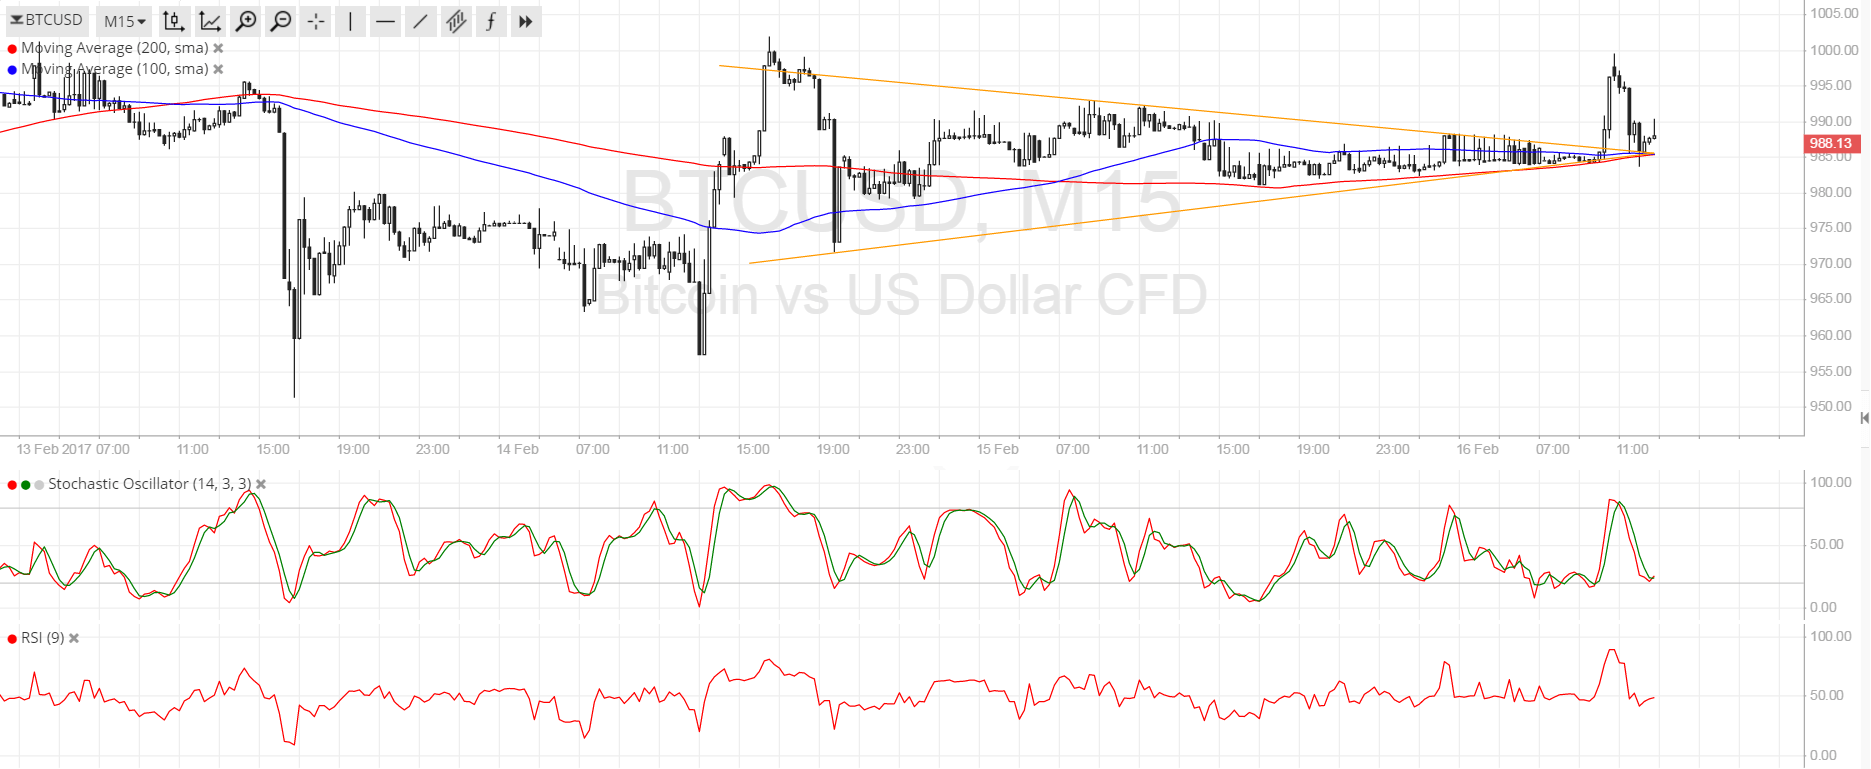
Bitcoin price made an upside breakout from its symmetrical triangle but failed to sustain the climb, which suggests that consolidation could still stay in play.
Technical Indicators Signals
The moving averages are oscillating on this time frame, which means that ranging market conditions could persist. In the event that a downward or upward crossover materializes, bitcoin price could gain more traction in a particular direction. For now, the moving averages are holding as dynamic support, which reflects a bit of upside bias.
Stochastic is heading south so there may be some selling pressure left, but the oscillator is already closing in on the oversold area. In that case, buying pressure could return soon and push bitcoin price back up to the resistance at $1000. RSI is also on the move down so bitcoin could follow suit, possibly making its way to the next near-term area of interest at $975 or onto the range support at $960.

Market Events
There still a general feeling of unease in bitcoin markets spurred mostly by the developments in China, in which top exchanges were forced to introduce trading restrictions to help the government investigate money laundering activity. Aside from that, BTCUSD is under a bit of selling pressure on dollar strength, as traders anticipate a Fed rate hike in March and strong US equity gains on Trump’s tax reform plan.
However, there have been several positive developments in the bitcoin industry that are worth noting and might allow it to stay afloat. For one, there’s talk of Iran possibly adopting bitcoin as a reserve currency. Also, bitcoin has been enjoying a lot of interest in Wall Street funds while banking troubles in Europe could shore up demand for alternative currencies once more.
Charts from SimpleFX