Bitcoin Price Key Highlights
- Bitcoin price recently made a sharp drop, breaking below several key support zones.
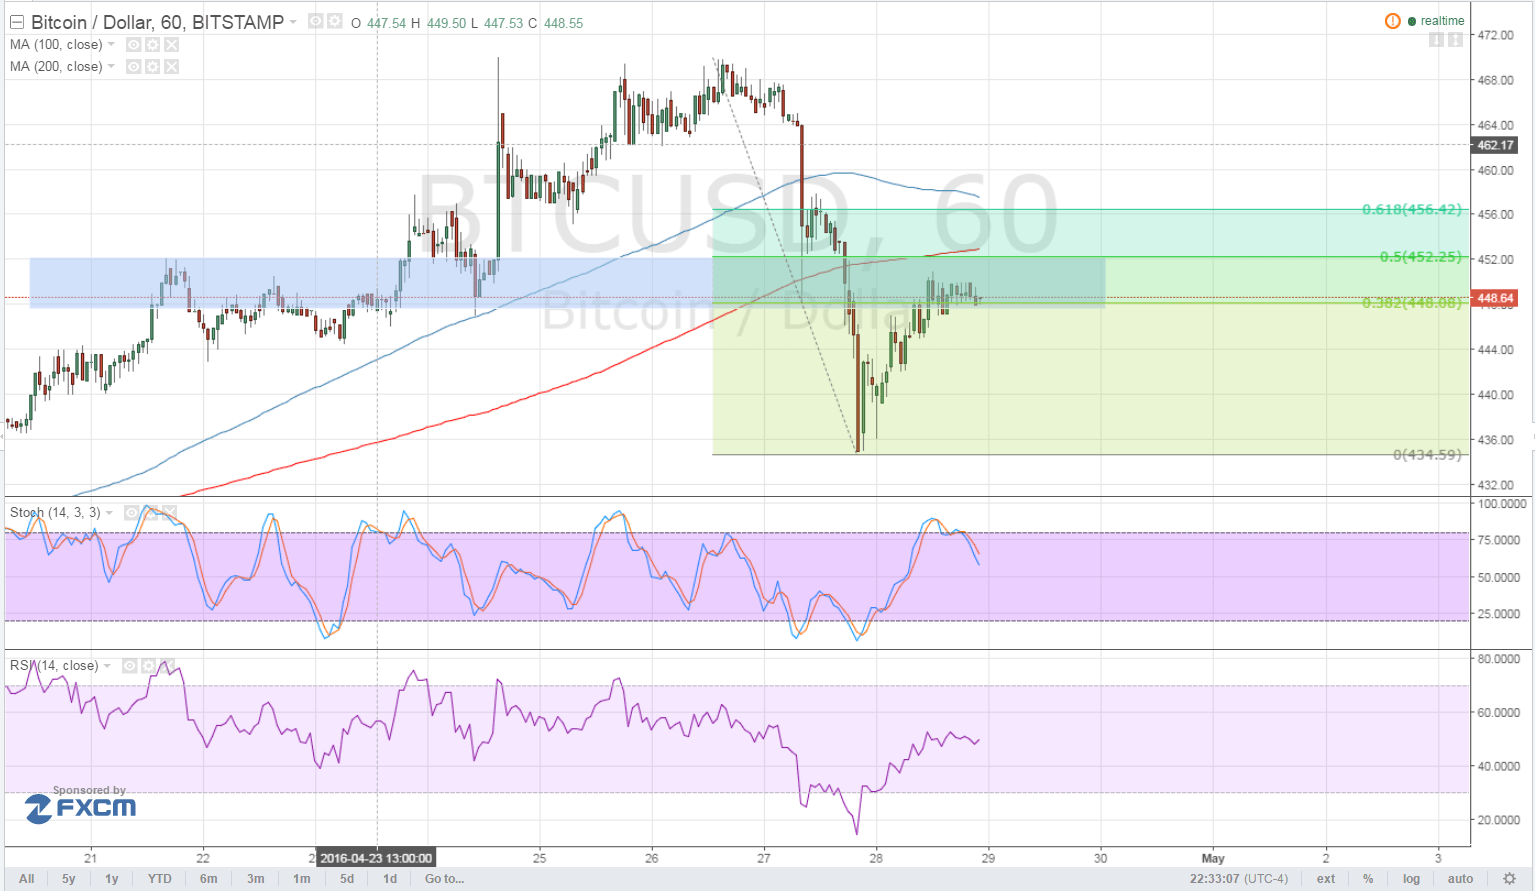
- Price bounced off the $435 area and appears to be making a pullback from its recent dive.
- Bitcoin is testing the resistance at the area of interest and 38.2% Fibonacci retracement level on the latest swing high and low on the 1-hour time frame.
Bitcoin price could be due for another selloff if the short-term resistance levels keep gains in check.
Technical Indicators Signals
The 100 SMA is still above the longer-term 200 SMA so the path of least resistance is still to the upside. However, the gap between the moving averages is narrowing so a downward crossover might take place. In addition, the 200 SMA lines up with the 50% Fib while the 100 SMA coincides with the 61.8% Fib.
Stochastic is heading down from the overbought area, which confirms that sellers are taking control and might push bitcoin price back to the previous lows or much lower. RSI, on the other hand, is on the move up so price could follow suit and make a larger retracement to the higher Fib levels.
A break past the 61.8% Fib and 100 SMA could signal that a longer-term uptrend is in play, especially since bitcoin price recently made a strong upside break from a long-term triangle consolidation pattern.

Market Events
The US dollar has been weakening for the past few weeks, owing to downbeat economic reports. This prompted the FOMC to make a more cautious statement, downgrading their assessment of economic growth and inflation. Fed Chairperson Yellen also refrained from giving hints on when their next policy tightening action might be.
The advance US GDP reading turned out to be a disappointment, as the report showed that the economy grew by only 0.5% in Q1 2016, its weakest pace of growth in two years.
With that, the US dollar could see more weakness down the line, as investors lower their expectations for a June rate hike. However, most major central banks have been shifting to a more dovish stance recently, bringing risk aversion back to the table.
Charts from Bitstamp, courtesy of TradingView