Bitcoin Price Key Highlights
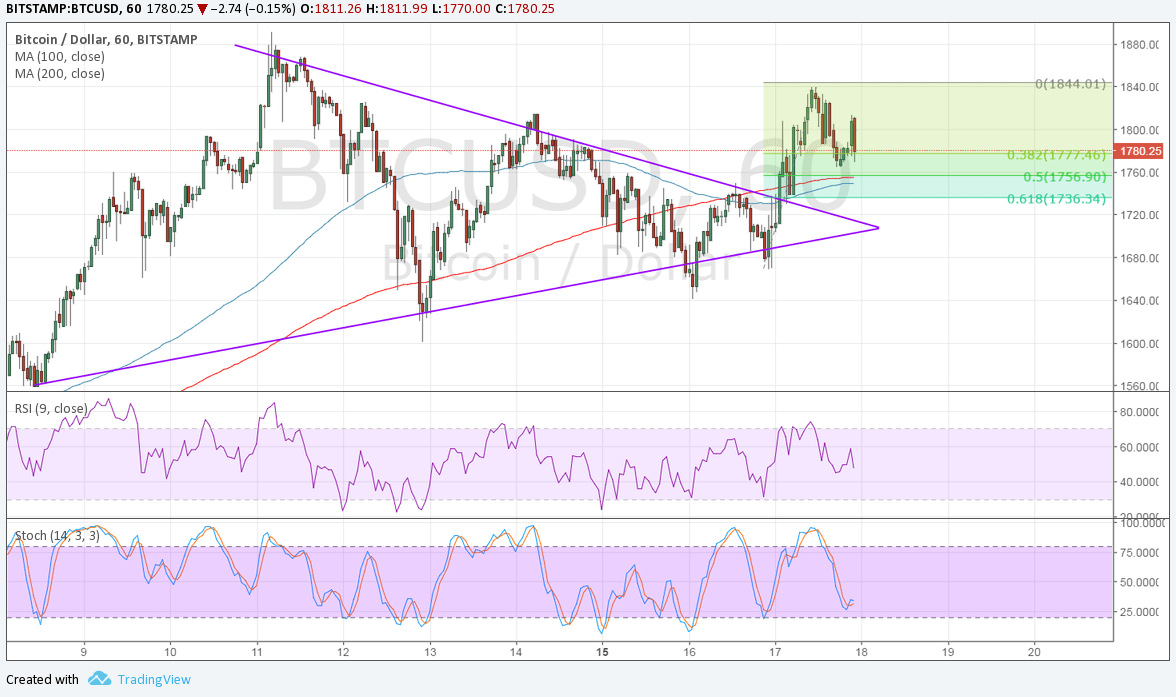
- Bitcoin price just broke to the upside from its short-term triangle consolidation pattern.
- This is an early indication that bulls are charging again as new market factors have emerged.
- A quick pullback to the broken triangle resistance could take place before more buyers join in.
Bitcoin price made an upside break from its triangle consolidation pattern to signal that bulls are ready to charge again.
Technical Indicators Signals
The 100 SMA is still below the longer-term 200 SMA on the 1-hour chart, though, so there’s a chance that bears could take over bitcoin price. However, the gap between the moving averages is narrowing to suggest that an upward crossover might be underway.
RSI is heading south to indicate a pickup in bearish pressure while bitcoin price is currently in correction mode. Applying the Fibonacci retracement tool on the latest swing low and high on this short-term chart shows that the 61.8% level lines up with an area of interest close to the moving averages and broken triangle resistance.
Stochastic seems to be pulling up from its drop even without hitting the oversold regions. If this is indicative of bullish momentum, bitcoin price could resume its climb to the swing high around $1844 or go for another test of the all-time highs around $1800. Stronger buying pressure could even lead to the creation of new record highs.

Market Factors
In the past few weeks, bitcoin price has drawn support from improving legitimacy and speculations of the COIN ETF approval. However, these themes took a hit when the WannaCry ransomware attack revived the cryptocurrency’s reputation for being used to facilitate criminal activity.
This time around, the attention has shifted to geopolitical uncertainties, particularly when it comes to the Trump administration. The Justice Department has called for an official probe into the alleged intelligence information leak, leading investors to speculate about delays in fiscal reform and even potential impeachment proceedings. Financial markets reacted to this pickup in uncertainty with a rise in VIX, which has proven to be positive for alternative assets like bitcoin and other cryptocurrencies in the past.