Bitcoin Price Key Highlights
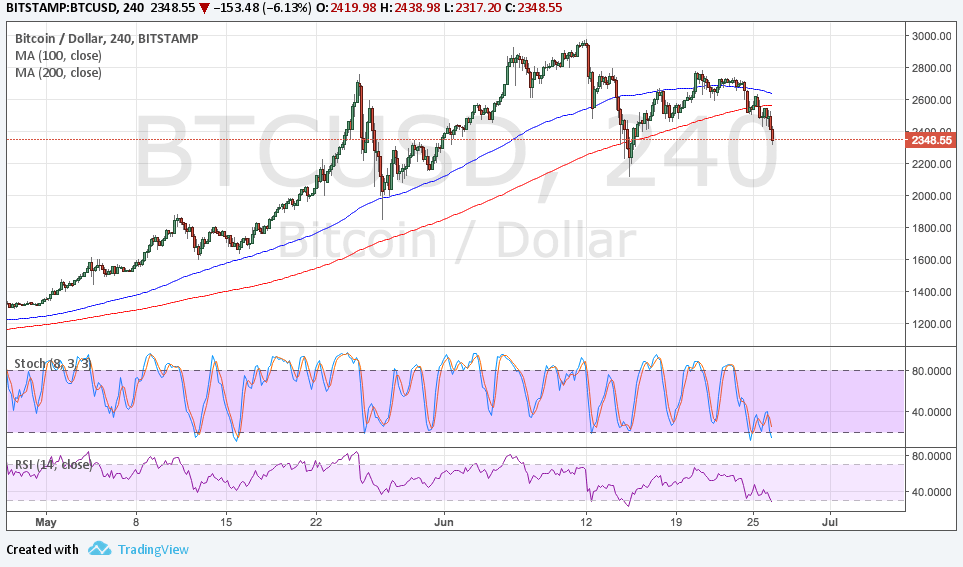
- Bitcoin is still selling off, making the head and shoulders pattern previously hinted at earlier this month more visible.
- Price is on its way to complete the right shoulder and to test the neckline around the $2300 level.
- A break below this level could confirm that a long-term selloff is in the cards.
Bitcoin price is already completing the last part of its reversal formation to signal that a downtrend is about to happen.
Technical Indicators Signals
The 100 SMA is above the 200 SMA for now, but the gap is narrowing to indicate that a downward crossover is looming. If this is completed, more bears could join the game and push for losses in bitcoin price.
The neckline is a diagonal one around the $2300 mark, so a break below this level could send bitcoin price lower by around $700 or the same height as the chart pattern. If it continues to keep losses in check, a quick bounce could be seen.
Stochastic is already indicating oversold conditions, which means that sellers are getting exhausted and could take a break soon. RSI is still pointing down to show that there’s bearish pressure in play but this oscillator is also nearing the oversold area.

Market Factors
Dollar demand has picked up since the June FOMC statement when the Fed decided to hike interest rates as expected. The US central bank also upgraded growth and jobs forecasts while confirming that they’re on track to tighten again before the end of the year and unwind their balance sheet holdings.
Meanwhile, bitcoin price has taken a hit from rising skepticism, following bearish remarks from well-known analysts and investors. To top it off, Ethereum suffered a flash crash in the GDAX so traders are wary that cryptocurrencies are still unsteady.
Moving forward, market sentiment could dictate where bitcoin price is headed next, but there’s also a very strong chance of profit-taking as the end of the month and quarterly draws near. With that, bitcoin price could erase more of its gains from the past three months as investors book profits.
SaveSave