Bitcoin Price Key Highlights
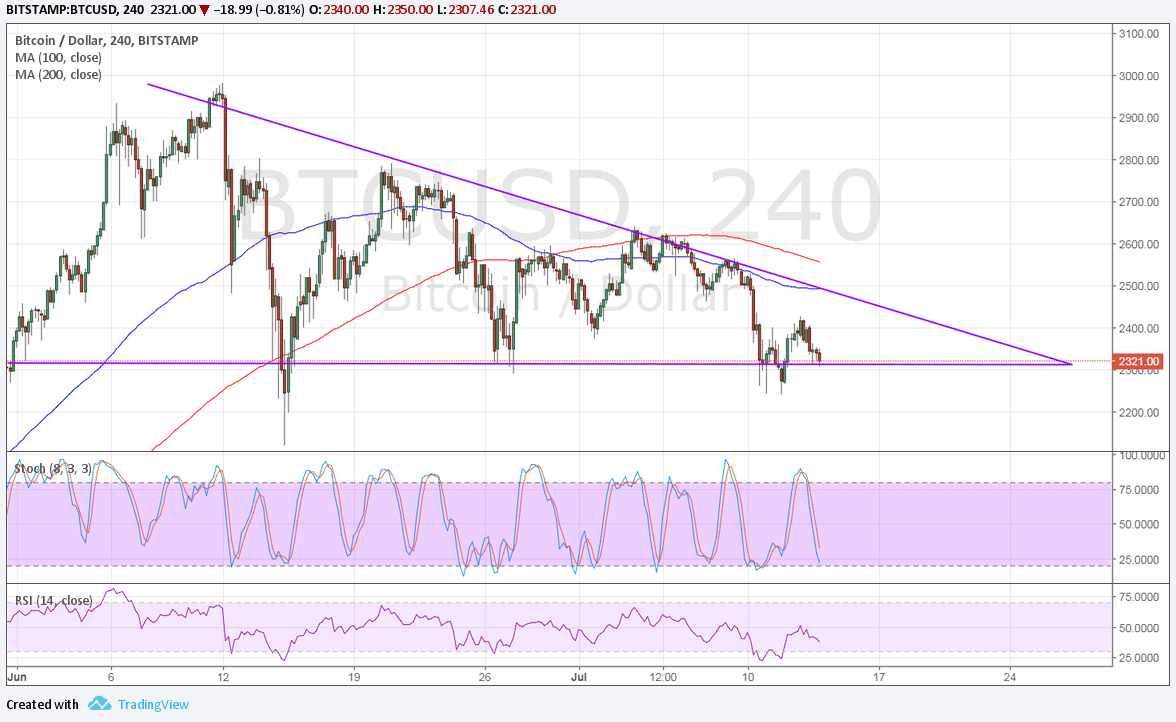
- Bitcoin price has formed lower highs and found support around $2320, creating a descending triangle pattern visible on its 4-hour chart.
- Price is currently testing the triangle support, still deciding whether to make a bounce or a break.
- Technical indicators are signaling that further losses are in the cards.
Bitcoin price is hovering at the bottom of its descending triangle and could be due for a downside break.
Technical Indicators Signals
The 100 SMA is below the longer-term 200 SMA so the path of least resistance is to the downside. In other words, a breakdown is more likely to happen than a break to the upside.
Also, the 100 SMA lines up with the triangle resistance so a bounce up to that level could still see its gains limited. The 200 SMA dynamic resistance could serve as the line in the sane for any rallies, although a break past that area could signal that bulls have the upper hand once more.
On the other hand, a move below the $2320 triangle support could be enough to confirm that further losses are in the cards. The triangle pattern spans $2320 to $2970 so the resulting selloff could last by the same height.
Stochastic is pointing down to signal that sellers are in control of bitcoin price action. RSI is also turning lower without even hitting overbought conditions to indicate that bears are eager to get back in the game.

Market Factors
Dollar demand continues to stay supported, thanks to Fed chatter on future rate hikes and the balance sheet runoff. In her latest testimony, Fed Chairperson Yellen mentioned that unwinding could impact longer-term interest rates, which then affects dollar price action.
As for the bitcoin industry, bearish remarks from analysts in Morgan Stanley have kept a lid on gains. The lack of positive updates also discourages investors from putting more money in the cryptocurrency for now.
Still, news that Swiss bank Falcon introduced bitcoin in its private asset management service is being closely watched. Reports are indicating that this has been given the thumbs-up by regulators, thereby supporting the legitimacy of the product.