Bitcoin Price Key Highlights
- Bitcoin price is still trading around its ascending triangle on the 1-hour chart but appears to be slowly breaking below support.
- It’s too early to conclude if this is a valid breakout because price is still pretty close to the bottom and has yet to show more downside momentum.
- Technical indicators are also suggesting that bullish pressure is still in play.
Bitcoin price is trying to break below the ascending triangle support on the 1-hour time frame, but there’s also a chance that this could be a fake out.
Technical Indicators Signals
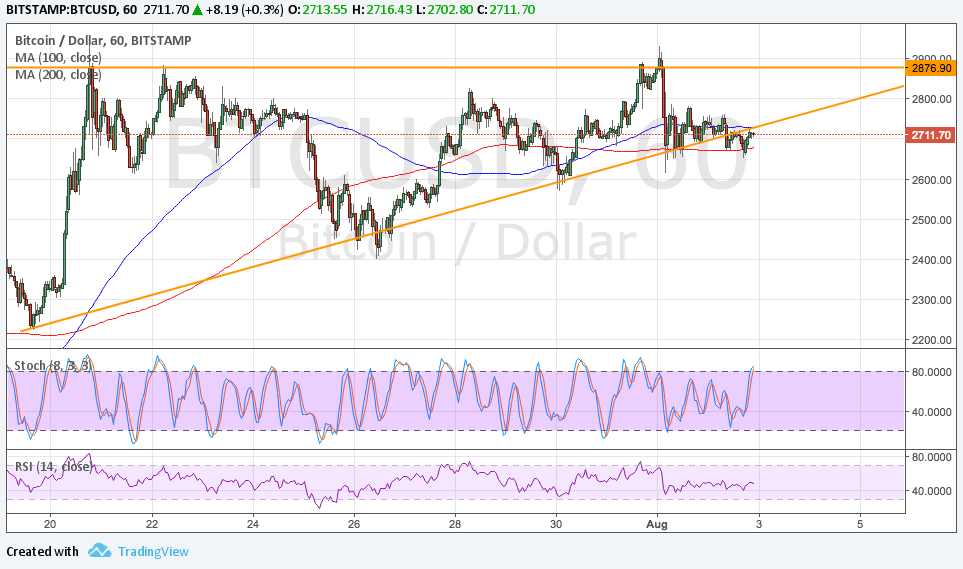
The 100 SMA is above the longer-term 200 SMA so the path of least resistance is to the upside. However, the moving averages have also been oscillating so this may merely mean that consolidation could continue. The moving averages are close to the triangle bottom, adding to its strength as support.
A break below the 200 SMA could be enough to confirm that a downtrend is underway and that bears are gaining the upper hand. The chart pattern spans $2200 to $2875 so the resulting selloff could be of the same size.
Stochastic is still pointing up to show that buyers have enough energy to push for a bounce back to the triangle resistance. This oscillator is nearing overbought levels, though, and crossing lower could draw more bears to the game. RSI continues to move sideways to signal more consolidation as well.

Market Factors
Bitcoin has officially split into two versions earlier this month, with the newer one being accepted in only a few exchanges. Although incompatibility concerns are keeping a lid on bitcoin price gains for now, many believe that network acceptance will favor the main version which has just upgraded to SegWit2x to handle more transactions.
Meanwhile, there’s also a lot of attention on the dollar these days as the NFP release approaches. Leading jobs indicators such as the ISM manufacturing survey and the ADP report signal a slight slowdown in hiring for July so traders are not setting the bar too high this time. If the actual figure still manages to impress, the dollar could advance versus bitcoin price.