Bitcoin Price Key Highlights
- Bitcoin price recently made a strong rally and zooming in to the 1-hour chart shows potential correction levels.
- A bullish flag pattern can be seen on the longer-term time frames but it looks like buyers would need to wait for a pullback.
- Technical indicators are showing mixed signals at the moment, which suggests a possible short-term retracement on the ongoing uptrend.
Bitcoin price might be in for a pullback opportunity to these inflection points before resuming its climb.
Technical Indicators Signals
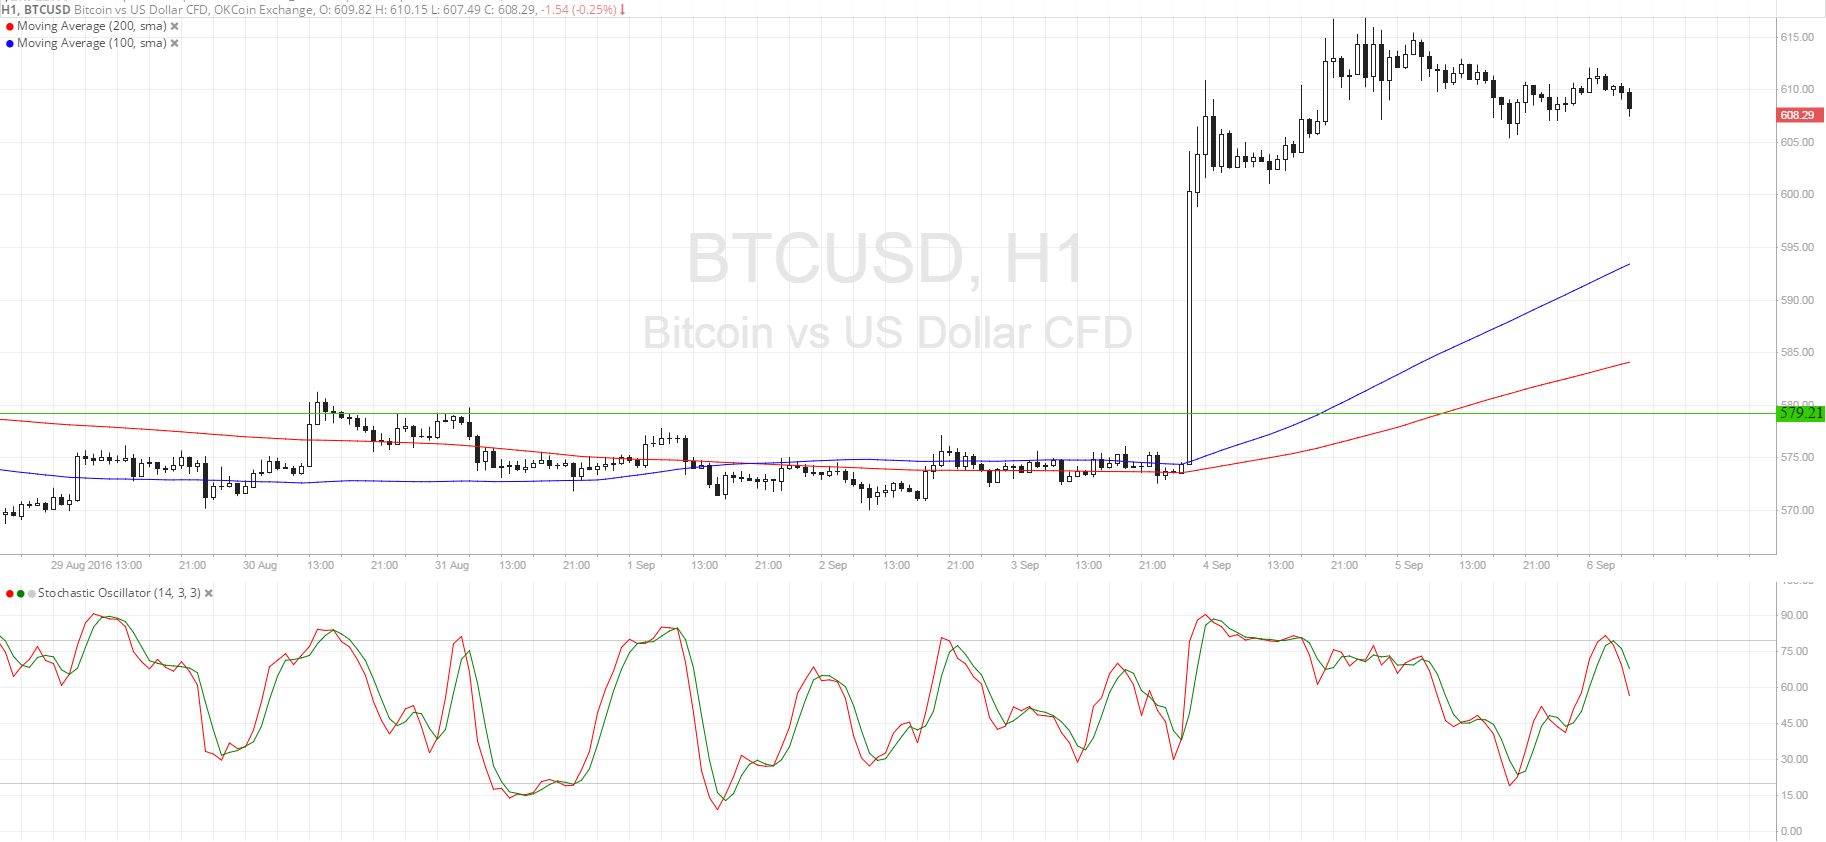
The 100 SMA is above the longer-term 200 SMA on the 1-hour chart, confirming that the path of least resistance is to the upside and that the climb could continue. Apart from that, the gap between the moving averages is widening, which means that bullish momentum is getting stronger.
Stochastic is pointing down, though, so bears might be taking control of bitcoin price action from here. This could mean a short-term correction opportunity for more buyers to buy at cheaper levels. Price could pull back to the 100 SMA dynamic inflection point at $600 or to the 200 SMA near $585. A larger correction could last until the broken resistance around $580.

Market Events
The lack of liquidity in yesterday’s U.S. Labor Day holiday kept bitcoin price in its range yesterday, with traders set to return to their desks and likely spur more volatility today. It appears as though risk sentiment is the main driving force in the financial markets today, as traders are watching Fed rate hike odds and commodity prices.
So far, the lack of resolve among energy-rich nations has been weighing on crude oil and other higher-yielding assets like bitcoin. Saudi and Russia made a joint statement yesterday but only to say that they’ve formed a working group to monitor oil price movements, leading investors to doubt that any plan of action will be announced in the OPEC informal meeting later this month.
Still, uncertainty in the forex and equity market could encourage investors to put funds in bitcoin for the next few days as central bankers from Australia, the euro zone, and Canada are set to announce their policy decisions within the week.
Charts from SimpleFX