Bitcoin Price Key Highlights
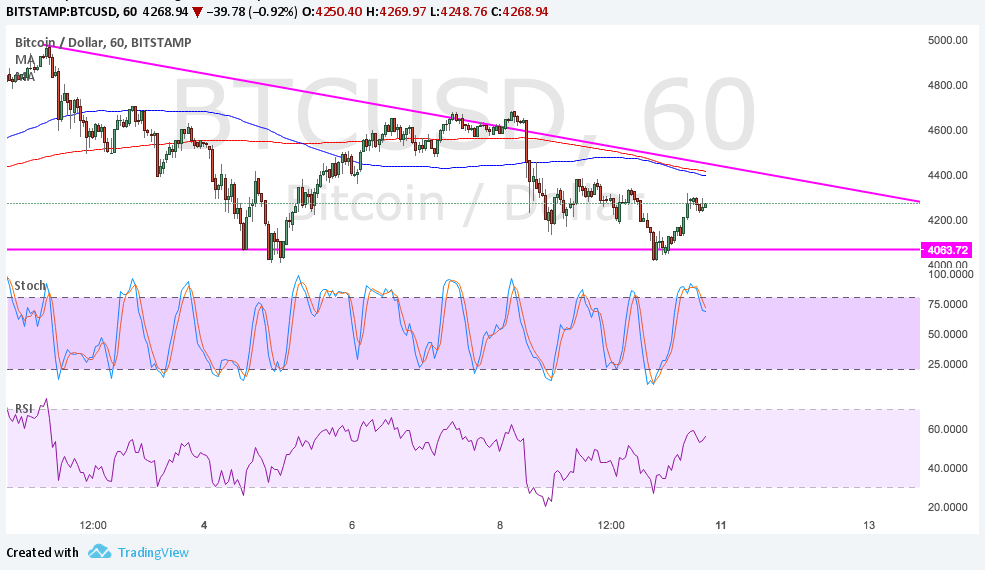
- Bitcoin price has formed lower highs and found support around $4060, creating a descending triangle pattern.
- Price just bounced off support and could be due for a test of resistance soon.
- Most technical indicators on the 1-hour chart hint that the top of the triangle could keep gains in check.
Bitcoin price is consolidating inside a descending triangle pattern and could stay within the formation until a catalyst triggers a breakout.
Technical Indicators Signals
The 100 SMA is below the longer-term 200 SMA to signal that the path of least resistance is to the downside. These moving averages are close to the top of the triangle to add strength to the ceiling.
Stochastic is turning lower from the overbought zone to signal that selling pressure is returning. RSI is still on the move up so there may be some bullish momentum left for an actual test of resistance.
A breakout in either direction could last by $400, which is roughly the same height as the chart formation. Bitcoin price could also encounter resistance at the record highs near $5000 and support at the $3800-4000 area of interest.

Market Factors
Geopolitical risks appear to have faded recently as traders are awaiting the next updates from North Korea. There appear to have been no provocations over the weekend, although another batch of sanctions could trigger a reaction.
Meanwhile, dollar demand continues to weaken ahead of this month’s FOMC decision as cautious remarks are expected. This week, the catalysts for the currency include the US CPI and retail sales, both of which are expected to come in weak.
As for bitcoin price itself, reports that China is shutting down exchanges have kept a lid on gains in the past few days. This follows the report that China has banned ICO funding, leading many to speculate that more restrictions are in the cards.
Keep in mind that China has been one of the largest bitcoin markets in the world, although the likes of the US, Japan, and South Korea have caught up. With that, there doesn’t appear to be much worry on the part of investors for the time being.