Bitcoin Price Key Highlights
- Bitcoin price continued its ascent and is starting to breach the barrier at the 50% extension level.
- Looking at the next extension levels shows the upside targets while bitcoin continues to stay supported by bullish momentum.
- Technical indicators on the daily time frame also suggest a continuation of the climb.
Bitcoin price is carrying on with its climb and the Fibonacci extension levels indicate the next potential upside targets.
Technical Indicators Signals
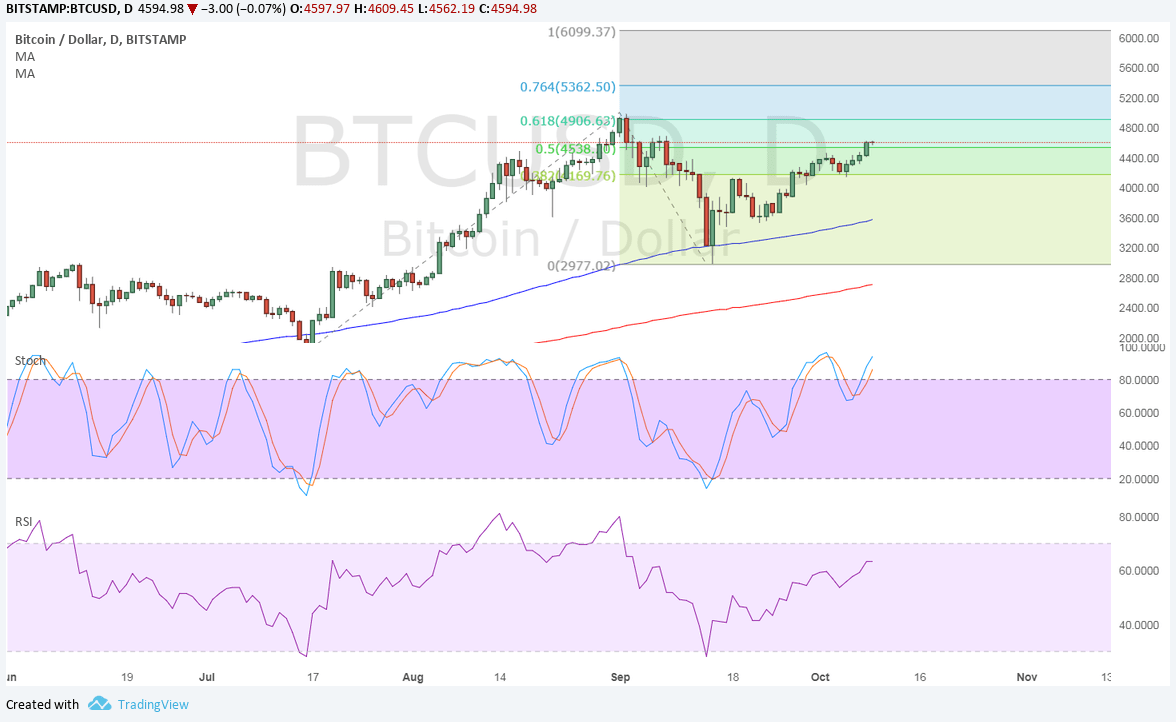
The 100 SMA is safely above the longer-term 200 SMA on this chart so the path of least resistance is to the upside. This means that the rally is more likely to continue than to reverse. The gap has also been maintained, indicating steady upside momentum.
Stochastic is pointing up to show that buyers are in control of bitcoin price action but the oscillator is also hovering around the overbought zone to signal rally exhaustion. RSI has more room to climb so bulls could stay on top of the game for a bit longer.
The next ceiling is at the 61.8% extension or $4906.62 near the swing high. The 76.4% extension is at $5362.50 and the full extension is at $6099.37. If any of the levels keep gains in check, bitcoin price could pull back to the 100 SMA dynamic support which has held in the past couple of tests.

Market Factors
The US NFP figure turned out much weaker than expected for September, triggering some dollar weakness to bitcoin price. The report showed a 33K drop in employment for the month versus the estimated 82K gain and the earlier figure, which enjoyed an upward revision. However, traders still seem to be holding out for an upgrade in the September reading later on.
The main event risks for the dollar this week include the FOMC minutes and the release of inflation and consumer spending data. A couple of positive updates, which include a potential regulatory frame work for blockchain-based assets in Europe and the addition of bitcoin trading for Brazil’s biggest financial firm XP Investimentos, have buoyed bitcoin price higher so far.