Bitcoin Price Key Highlights
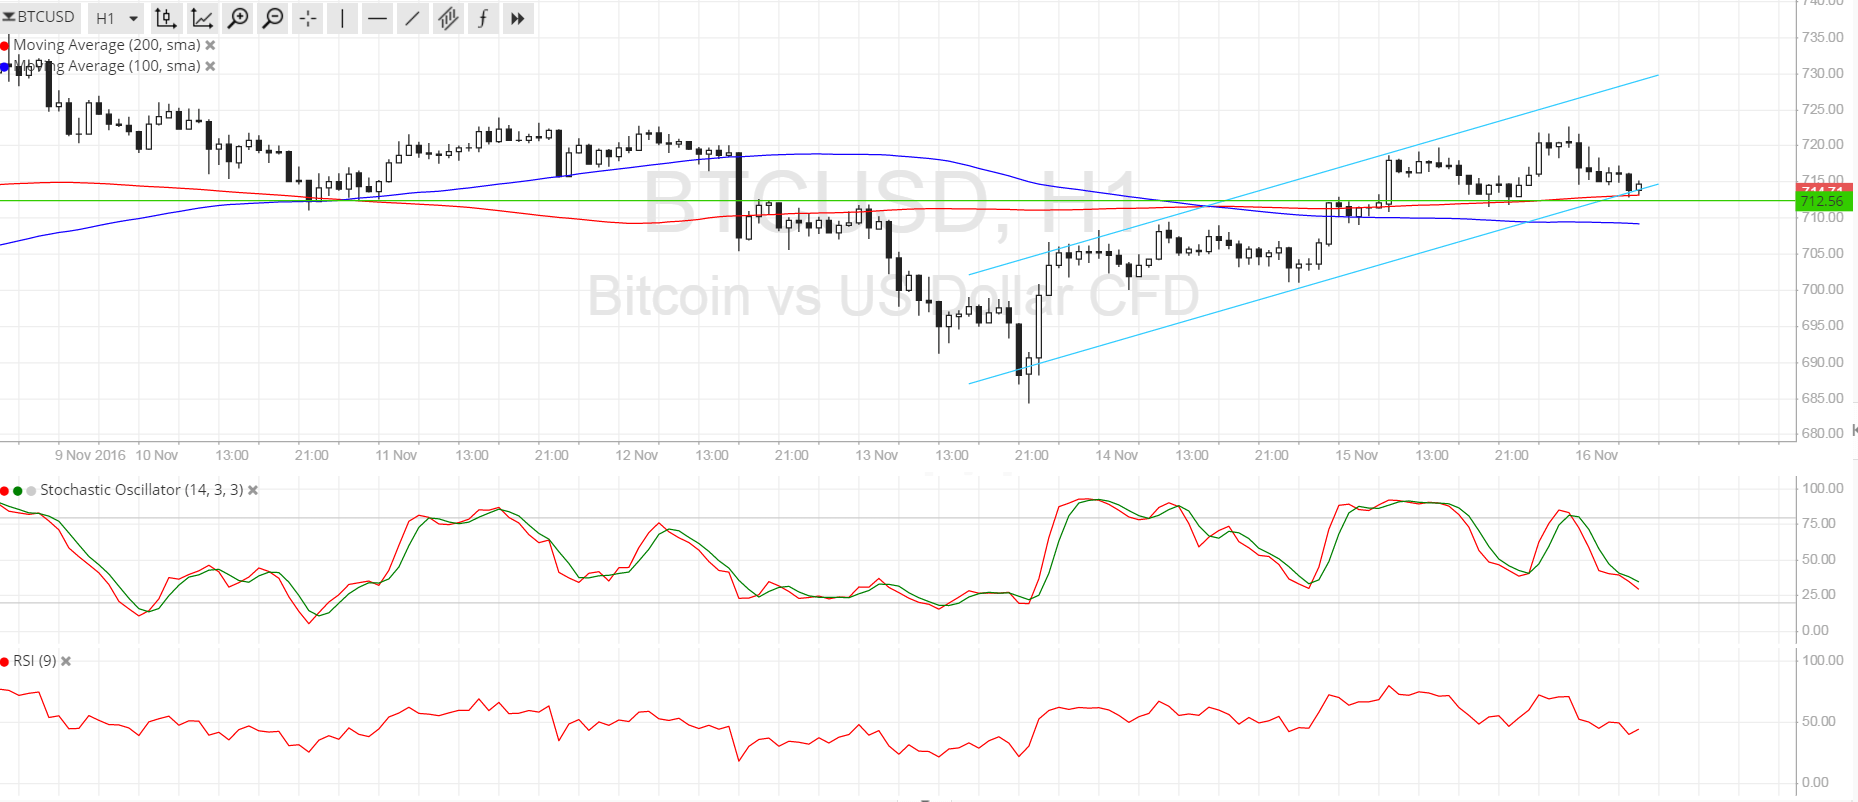
- Bitcoin price is establishing a new uptrend, forming an ascending channel visible on its 1-hour chart.
- In addition, price seems to have broken above the symmetrical consolidation pattern illustrated in an earlier article, signaling further upside.
- Bitcoin is still testing an area of interest for the time being and technical indicators are giving mixed signals once more.
Bitcoin price appears to have chosen to take the northbound route and is waiting for more bulls to sustain the climb.
Technical Indicators Signals
The 100 SMA is below the 200 SMA on this time frame, hinting that the path of least resistance is to the downside. However, these moving averages have been oscillating so this might merely be indicative of consolidation for now. Also, the 200 SMA is holding as dynamic support for the time being and an upward crossover might be due.
Stochastic is on the move down to show that sellers are in control of bitcoin price action, but the oscillator is nearing the oversold region to indicate that bearish pressure is exhausted. RSI is also heading south so price could follow suit and make a test of the 100 SMA dynamic support.
Note that bitcoin price is already testing the ascending channel support around $715 and that this lines up with an area of interest that has been holding as either support or resistance, depending on the trend.

Market Events
Bitcoin price has shrugged off the recent weakness as traders are reestablishing their long positions. Yuan weakness has been in play so far this week when the government set the trading range lower again, leading Chinese investors to hedge against their local holdings once more and pushing bitcoin higher across the board.
However, dollar bulls are also putting up a fight since retail sales data from the US has been stronger than expected for October while the previous month saw upgrades. This could keep the Fed on track towards tightening in December, especially if this week’s CPI and PPI readings beat forecasts. Keep in mind that Yellen’s testimony on Thursday could ultimately make or break these trends.
Charts from SimpleFX