

Bitcoin Price Key Highlights
- Bitcoin price is still on the decline, with the corrective wave from the previous price rally not yet completed.
- A rising trend line can be drawn connecting the recent lows of bitcoin price action since the start of this year.
Bitcoin price might make it all the way down to test the long-term rising trend line support before showing a bounce or resuming its climb.
Dynamic Support at SMAs
The rising trend line could serve as the line in the sand for any corrective moves off the long-term uptrend, as a break below this level could send bitcoin price in a free fall to the lows around $160. On the other hand, a bounce from the trend line support could at least keep the cryptocurrency on track to end the year on a positive note.
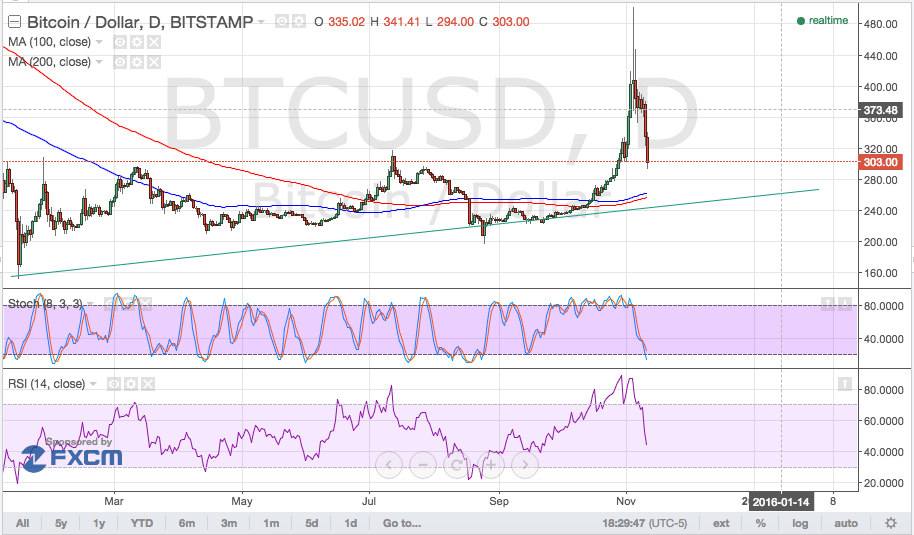

The rising trend line coincides with the 100 and 200 SMA, which might hold as dynamic support levels as well. The 100 SMA is above the longer-term moving average, indicating that the path of least resistance is to the upside, at least before a downward crossover takes place.
Stochastic is heading south and hasn’t quite reached the oversold region yet, which means that bearish momentum is still in play. RSI is much farther away from indicating that the selloff is exhausted so bitcoin price could have plenty of room to fall, possibly until $250.
At the moment, bitcoin price is stalling at an area of interest that lines up with a broken resistance area somewhere around $300-$320. If this holds as support, price could make another move north, although regaining ground back to the $500 levels could be quite a stretch since this sudden move was mostly spurred by speculation and an alleged Russian Ponzi scheme.
Intraday support level – $280
Intraday resistance level – $320
Technical Indicators Settings:
- 100 SMA and 200 SMA
- Stochastic (8, 3, 3)
- RSI (14)
Charts from BitStamp, courtesy of TradingView