

Bitcoin Price Key Highlights
- Bitcoin’s price is currently on an uptrend, with bulls coming out to play after the corrective wave was completed.
- As noted in the previous article, the area of interest around $350 held as support, and the Bitcoin price was able to make its way past the previous high at $380.
Using the Fibonacci extension on the latest impulse wave suggests that Bitcoin’s price has enough room to go north, possibly beyond the $400 mark.
Another Pullback?
So far, the moving averages have been holding as pretty strong dynamic support areas. In addition, an upward crossover appears to be underway, with the 100 SMA moving closer to the 200 SMA to indicate a pickup in bullish momentum.
However, if profit-taking continues to take place around the current levels, Bitcoin prices might decide to retreat to the trend line connecting the latest lows since mid-November. Stochastic analysis is already indicating overbought conditions and is turning lower, which suggests that buyers might need to take a break right now.
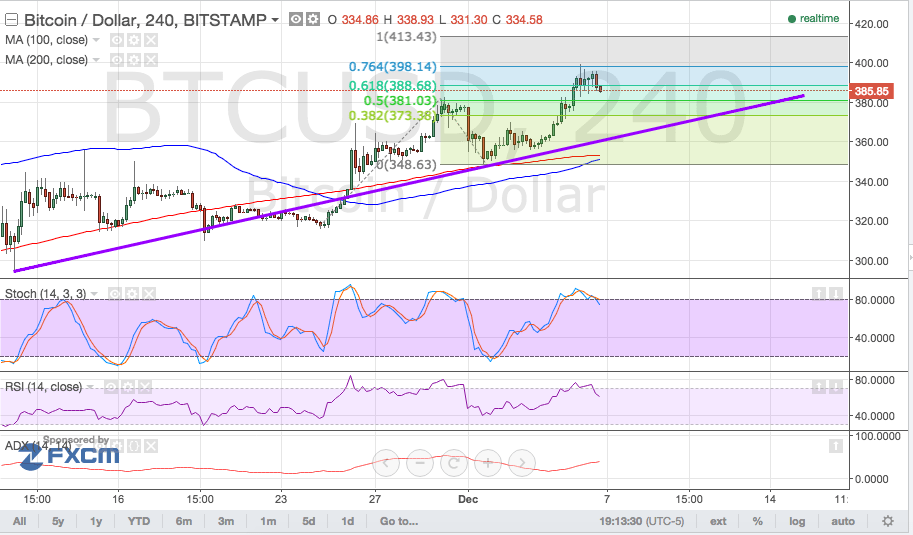

Aside from that, the RSI is showing a bit of bearish divergence from its lower highs in early December to the higher highs in Bitcoin prices. This adds another layer to the potential return in selling pressure, likely taking price down to the area of interest around the previous swing high to $380.
The average directional index may have dipped lower last week, but it is starting to turn higher again, which indicates a return to trending market conditions. This supports the idea that the ongoing uptrend might carry on, provided that the indicator is able to stay above the 50 level.
Instead of spurring dollar strength, stronger than expected jobs data from the US economy actually allowed risk appetite to return to the financial markets, spurring demand for higher-yielding and riskier assets like Bitcoin.
Charts from Bitstamp, courtesy of TradingView