

Earlier on today, we looked at the downward sloping channel that was forming in the bitcoin price, and suggested that – as a result of the fact the price was trading just shy of the channel’s resistance line – we may be in for some near term short side action. The European session is now drawing to a close, and we are heading towards the mid US afternoon and – later – the Asian open tonight. How can we use what we saw in today’s bitcoin price market to set up against any potential volatility going forward? Take a look at the chart below to get an idea of what we are watching, and where our targets and risk management parameters come in to play. The chart is a fifteen minute, intraday candlestick chart that shows the last thirty-six hours or so of price action.
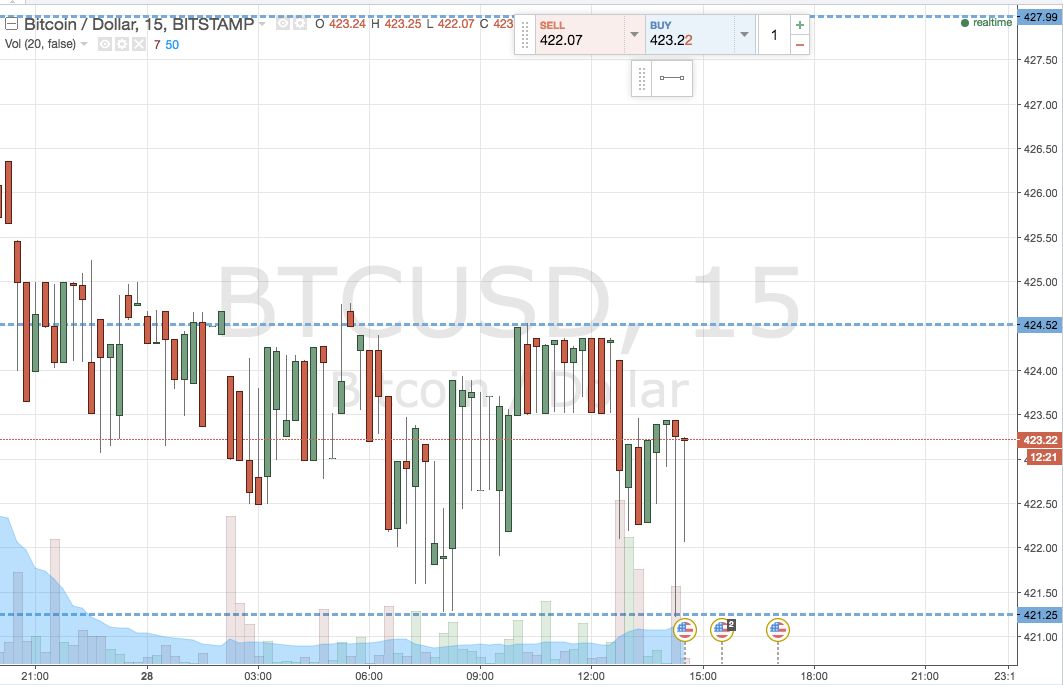

As the chart shows, we are looking at 421.25 to the downside as in term support, and 424.52 to the upside as in term resistance. It’s a tight range, so we wont be looking at anything intrarange for now – instead we’ll be focusing strictly on breakout entries.
As per the standard rules of our breakout strategy, if the bitcoin price closes above in term resistance, it will signal a long entry. We’ll get into the market with a target of 428 flat (highlighted), and use a stop loss somewhere in the region of 422.5 to keep things tight from a risk management perspective.
Looking short, a close below in term support will signal a short entry towards an initial downside target of 415 flat. This one is a little more aggressive (as determined by the overarching trend), so we’ve got a little bit more room to play with on the risk side of things. With this said, a stop at 423.5 works to minimize our upside risk nicely.
Charts courtesy of Trading View