So that’s the week pretty much done in the bitcoin price and it is time to put together some key levels that we can use moving forward into the session on Friday and that we can incorporate into our intraday strategy as things play out near term. We are going to jump straight into the action today without wasting any real time on analyzing overnight movement. What we will say, however, just quickly, is that things are gradually returning to the sort of action we have come to expect from bitcoin over the last few months. The upside momentum seems to be firmly in place and we haven’t had too many (or at least, too many steep) corrections of late. So, let’s get to the details. As ever, take a quick look at the chart below we get started so as to get an idea of where things stand and where we are looking to enter today. It is a one-minute candlestick chart that has our key range overlaid in red.
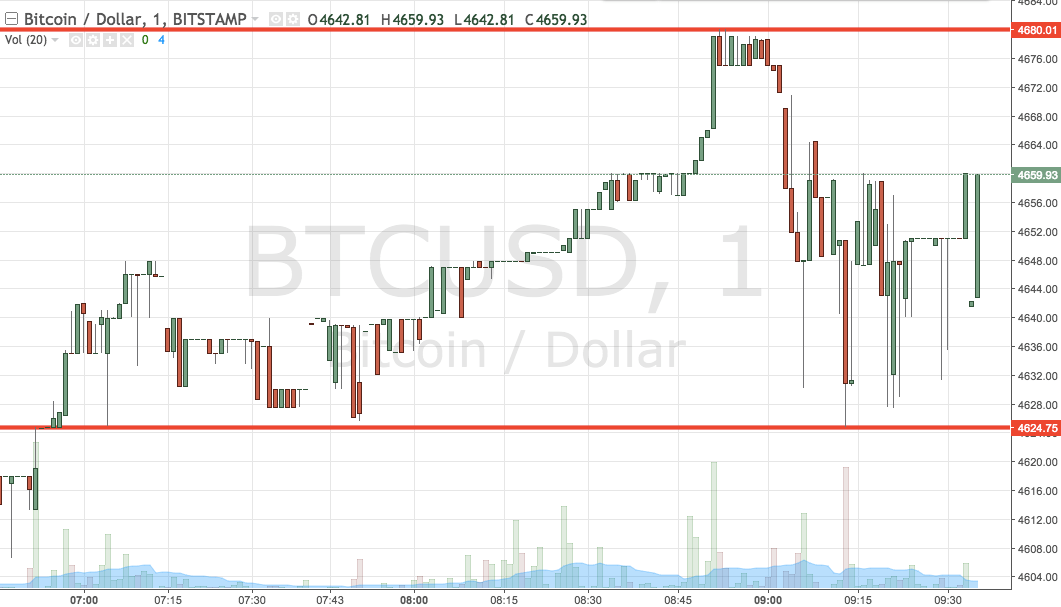

As the chart shows, the range we are looking at for the session today is defined by support to the downside at 4624 and resistance to the upside at 4680. We are going to enter long on a close above resistance (keep in mind that we need the close to validate entry; if we don’t see a close and we just get a break, it’s not a valid signal) towards an immediate upside target of 4710. A stop loss on this trade somewhere in the region of 4665 will ensure that we are taken out of the position in the event the price turns around and starts to trade against us.
Looking the other way, if price closes below support, we will jump into a short entry towards a downside target of 4590. A stop loss on this one at 4640 works well.
Charts courtesy of Trading View