The European market is drawing to a close, and it is time to take a look at our second analysis of the bitcoin price for the day. Things have been pretty volatile, and we have managed to get in to and out of a downside trade based on action seen during the session. In this morning’s analysis, we outlined a relatively tight range, and set up with some ultra tight scalp targets both above and below this range. For a while after published the analysis, price traded relatively flat, ranging between support and resistance of our range. A short while ago, however, price broke support, and after a slight bounce that saw it gain some upside strength, collapsed to take out our downside take profit target. We got out of the market around 590, and we are now net flat heading into this evening’s US and Asian sessions. So, with that said, and as we move forward into tonight’s trading, what are we looking at from the bitcoin price, and where are we going to look to get in and out of the markets according to our intraday strategy? Take a quick look at the chart below to get an idea of what we’re watching.
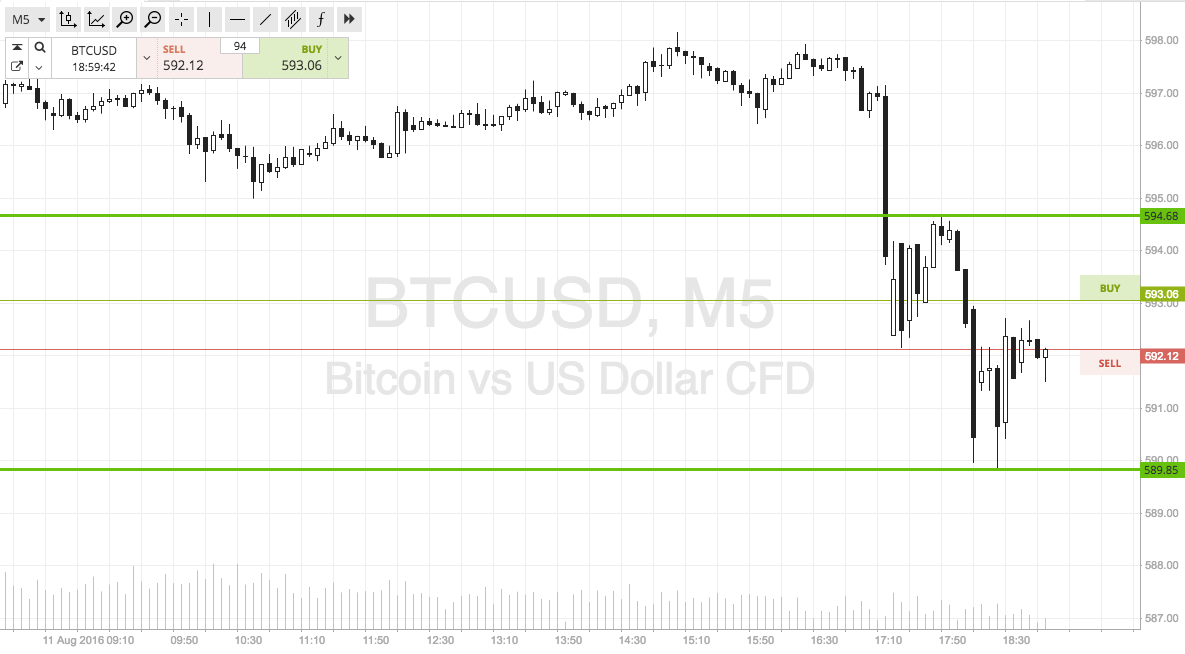

As the chart shows, we have shifted our range to the downside to incorporate the latest action. In term supports now sits at 589, while in term resistance comes in at 594. Again, this is too tight a range to try and trade intrarange, so we will be looking at a breakout strategy only this evening. Specifically, if price breaks above resistance, we will enter long towards an initial upside target of 600. A stop loss on this one around 592 works well. If price closes below support, we will enter short towards 581. Again we need a stop loss, and 592 again works well on the other side of the entry.
Charts courtesy of SimpleFX