Key Highlights
- Ripple price remains in an annoying range above the $0.1960 support against the US Dollar.
- This week’s highlighted major channel with current support at $0.1950 is placed well on the hourly chart of the XRP/USD pair (data source from Kraken).
- The price might extend the current decline and likely to test the channel support in the near term.
Ripple price did not move much against the US Dollar and Bitcoin. However, sooner or later, XRP/USD has to break either $0.2050 or $0.1950.
Ripple Price Consolidation
During the past two days, there was not much action in Ripple price above $0.1950 against the US Dollar. The price continues to trade in a tiny range with resistance close to the $0.2050 level. Yesterday, there was an attempt to break the $0.2050 resistance, but buyers failed to gain momentum. There was a failure near the 38.2% Fib retracement level of the last move down from the $0.2160 high to $0.1965 low.
The most important point is the fact that this week’s highlighted major channel with current support at $0.1950 is placed well on the hourly chart of the XRP/USD pair. The pair is currently below $0.2020 and the 100 hourly simple moving average. Therefore, there are chances of more declines toward the channel support at $0.1950 in the near term. A close below $0.1950 would be a strong sell signal and the price could even trade towards $0.1900.
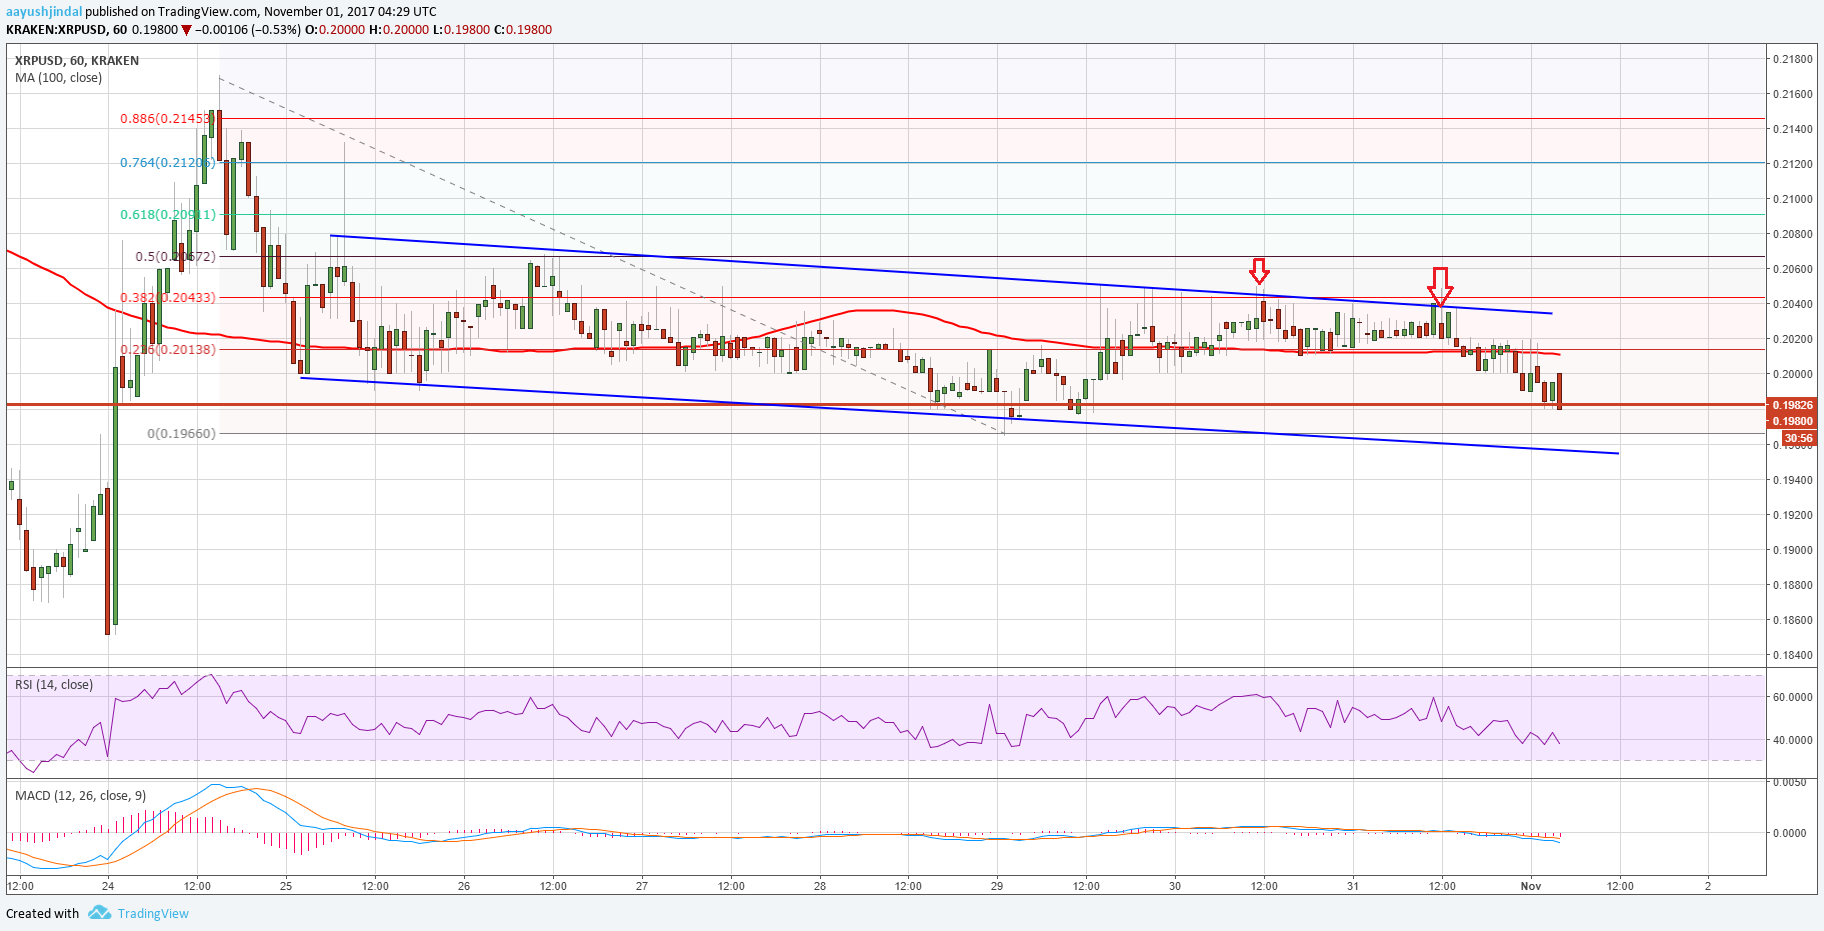
On the upside, an initial resistance is close to the 100 hourly SMA at $0.2020. However, the most important hurdle is near the channel resistance at $0.2050. Only a close above $0.2050 would open the doors for further upsides toward $0.2160.
Looking at the technical indicators:
Hourly MACD – The MACD for XRP/USD is slightly placed in the bearish zone.
Hourly RSI (Relative Strength Index) – The RSI for XRP/USD is currently well below the 50 level.
Major Support Level – $0.1950
Major Resistance Level – $0.2050
Charts courtesy – Trading View, Kraken