Reason to trust

How Our News is Made
Strict editorial policy that focuses on accuracy, relevance, and impartiality
Ad discliamer
Morbi pretium leo et nisl aliquam mollis. Quisque arcu lorem, ultricies quis pellentesque nec, ullamcorper eu odio.
Bitcoin Price Key Highlights
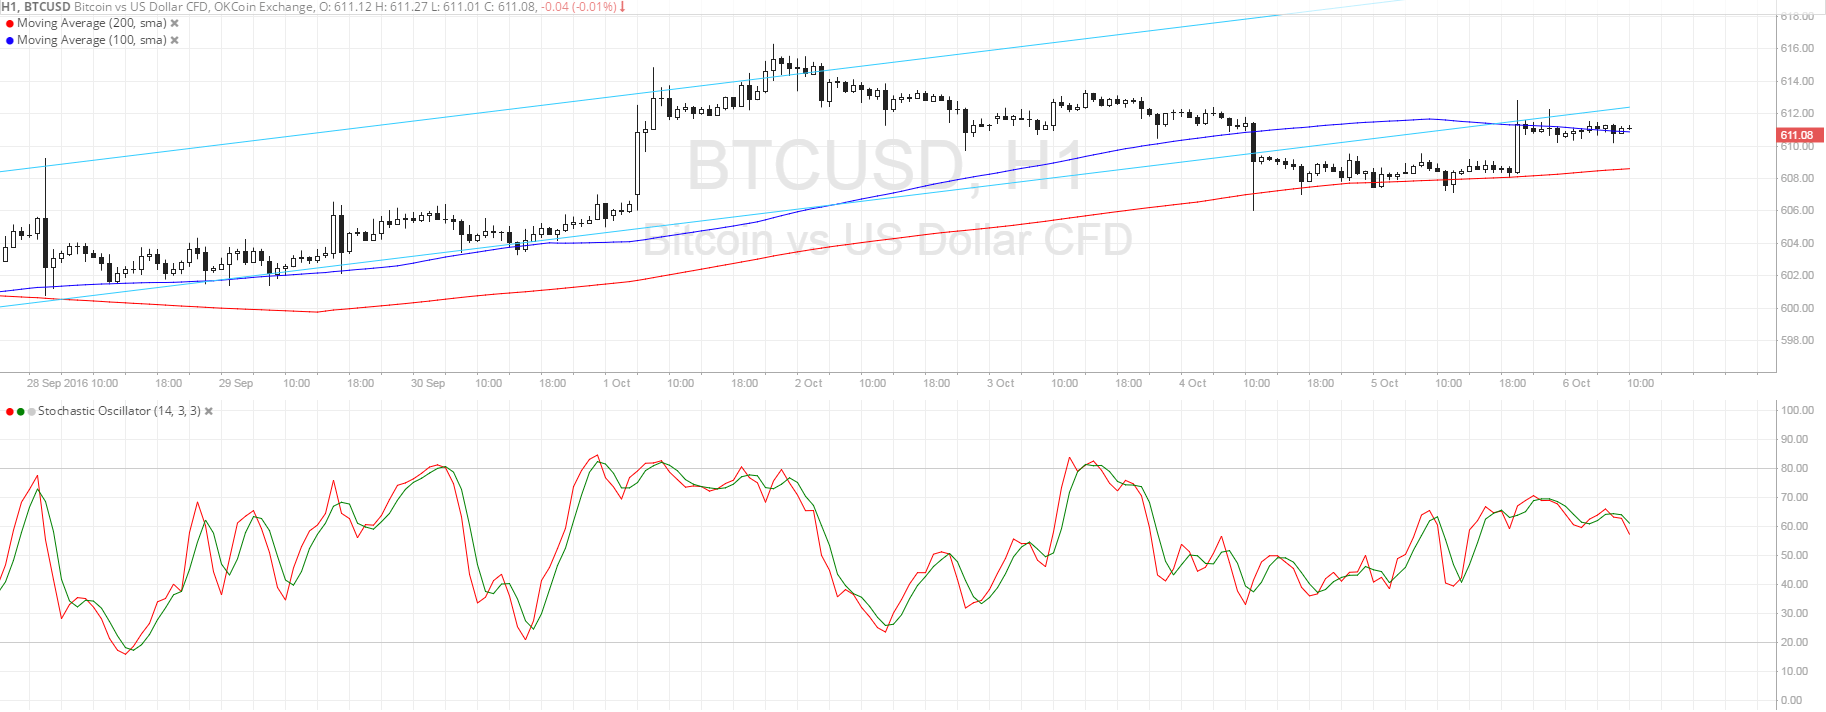
- Bitcoin price recently broke below its ascending channel support visible on the 1-hour and 4-hour charts.
- This signals that the uptrend may be over and that a reversal is in the works.
- Price found support at the 200 SMA and made a pullback to the broken channel floor, which might now hold as resistance.
Bitcoin price could be ready to resume its dive after this quick correction, but the consolidation does look like a continuation signal.
Technical Indicators Signals
The 100 SMA is above the longer-term 200 SMA still, which means that the path of least resistance is to the upside and the rally could resume. However, the gap between the moving averages is narrowing so a downward crossover may be imminent, causing more sellers to join in. Also, the 100 SMA appears to be holding as dynamic resistance for now since it lines up with the broken channel support.
Stochastic is pointing down to show that sellers are in control of bitcoin price action. In that case, price could resume its drop to the nearby lows at $608 or onto the next area of interest closer to $600.
On the other hand, a return in buying pressure could spur a move back inside the rising channel. If so, bitcoin price could be supported by bulls all the way up to the top of the range at $620.

Market Events
The US NFP report could be the main catalyst for bitcoin price action against the dollar this week, as traders are counting on a strong reading. Both ISM manufacturing and non-manufacturing PMI beat expectations and reflected employment gains so there’s a chance that the actual jobs figure could beat the consensus at 171K.
If that happens, traders could price in stronger expectations for a Fed rate hike in November, thereby driving dollar demand and dampening risk appetite, which would be a double whammy for bitcoin. On the other hand, disappointing results could cast doubts on Fed tightening and keep traders hoping for higher returns on riskier holdings like bitcoin.
Charts from SimpleFX


