At the end of last week, we noted that the bitcoin price had given us a pretty decent week from a trade perspective, and that it wouldn’t take too much volatility to get us in on a profitable close heading into the weekend. Things were pretty quiet over the weekend as it turned out, but we did manage to get in on a breakout trade and draw a small upside profit out of the markets. We are about to head into a fresh session on Monday morning out of Europe, and it’s time to take a look at how the most recent action is going to influence our strategy today.
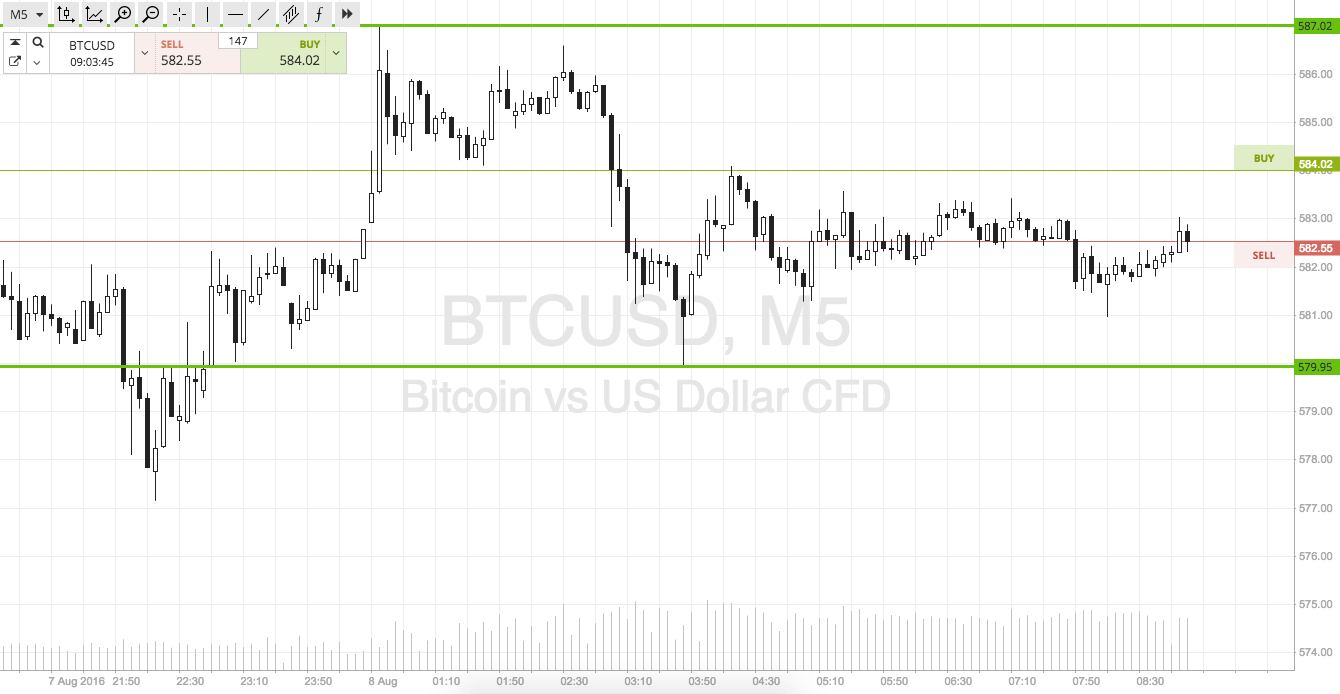
So, with that in mind, let’s take a look at some key levels for the day. As ever, take a quick look at the cart below to get an idea of what we are focusing on before the session kicks off. It’s a fifteen-minute candlestick chart with around twenty-four hours’ worth of action illustrated, and our key levels (the ones that form today’s range) outlined in green.

As the chart shows, the levels we are focusing on this morning are in term support to the downside at 580 flat, and in term resistance to the upside at 587. There’s just about enough room to go for an intrarange approach given current spread, so long at support and short at resistance, on a bounce or correction from either respectively. A stop just the other side of each entry defines risk.
On the breakout side of things, if price can close above resistance, we will get in long towards an initial upside target of 595. Stop at 585. Looking short, a close below support will signal a downside entry towards 570 flat. A stop on this one somewhere in the region of 582 keeps our risk tight.
Charts courtesy of Trading View


