
Reason to trust
How Our News is Made
Strict editorial policy that focuses on accuracy, relevance, and impartiality
Ad discliamer
Morbi pretium leo et nisl aliquam mollis. Quisque arcu lorem, ultricies quis pellentesque nec, ullamcorper eu odio.
Bitcoin gained bullish momentum above the key $8,800 resistance. As a result, BTC price surpassed $9,000 and it seems like the bulls are now aiming a test of $9,500.
- Bitcoin price is rising and it is now trading nicely above $9,000 against the US Dollar.
- The bulls are in control and there are high chances of a run towards $9,500.
- There is a key bullish trend line forming with support near $8,880 on the hourly chart of the BTC/USD pair (data feed from Kraken).
- The pair is likely to accelerate towards $9,500 if it clears the $9,200 resistance area.
Bitcoin Price Is Setting Up for $9,500
Yesterday, we discussed how bitcoin bulls aim big after the price surge above the $8,500 resistance. BTC even surged above the main $8,800 resistance level and the 100 hourly simple moving average to move further into a positive zone.
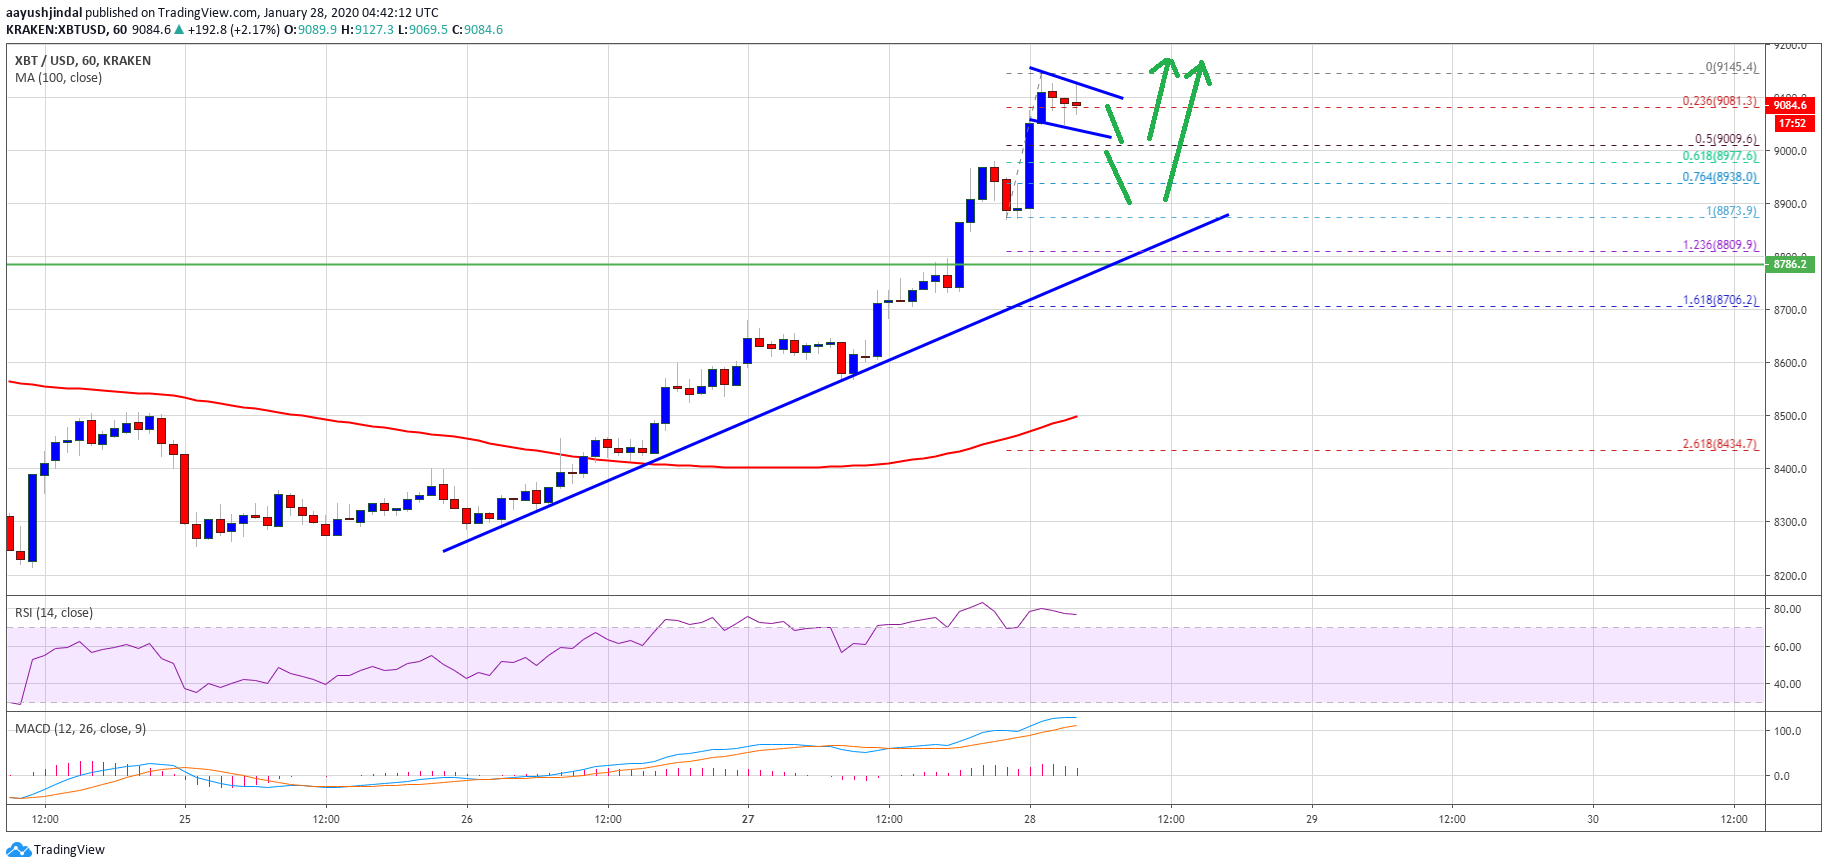
In the past three sessions, the price is up around 5% and it surpassed the $9,000 psychological barrier. A new weekly high is formed near the $9,145 and the price is currently correcting lower.
It is trading near the 23.6% Fib retracement level of the recent rise from the $8,873 low to $9,145 high. The first key support on the downside is near the $9,000 level.
Furthermore, the 50% Fib retracement level of the recent rise from the $8,873 low to $9,145 high is also near the $9,000 level to act as a strong support. If there are additional losses, bitcoin price might decline towards the $8,880 support area.
More importantly, there is a key bullish trend line forming with support near $8,880 on the hourly chart of the BTC/USD pair. If the price fails to stay above the $8,800 support, it could revisit the main $8,500 support area (the recent breakout zone).
Here Are Bullish Targets
In the short term, BTC might correct lower towards the $9,000 and $8,880 support levels. However, the bulls remain in control as long as the price is above $8,500 and the 100 hourly simple moving average.
On the upside, an initial resistance is near the $9,200 area. If bitcoin surges above the $9,200 resistance, it will most likely set the pace for a test of the $9,500 hurdle. Any further gains may perhaps call for a push towards $10,000 in the near term.
Technical indicators:
Hourly MACD – The MACD is showing positive signs in the bullish zone.
Hourly RSI (Relative Strength Index) – The RSI for BTC/USD is currently correcting from the overbought zone.
Major Support Levels – $9,000 followed by $8,880.
Major Resistance Levels – $9,150, $9,200 and $9,500.


